SG
SG  VN
VN 
Quadratic Equations And Functions
In this article, we are going to learn about Quadratic Equations and Functions, which cover the following subtopics:
- Graphs of Quadratic Functions
- Determining the shape of a Quadratic Graph
- Finding the intercepts of a Quadratic Graph
- Finding the line of symmetry and the turning point of a Quadratic Graph
- Sketching Graphs of Quadratic Functions
This article is written to meet the requirements of S3 Mathematics Syllabus in Singapore.
Graphs Of Quadratic Functions
Determining the shape of a Quadratic Graph
Ideally, the name of the shape of the Quadratic graph is called a “Parabola graph”.
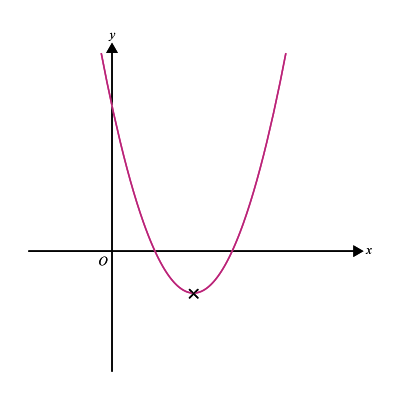
\(y=ax^2+bx+c\)
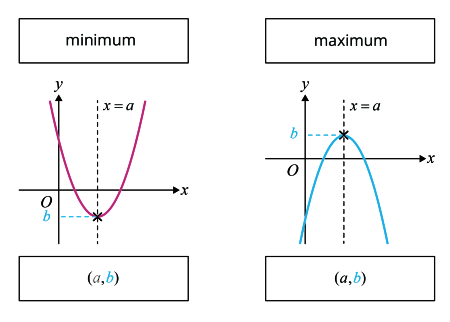
The given graph above is a minimum point graph.
If the value of \(a>0\), the graph has a minimum point.
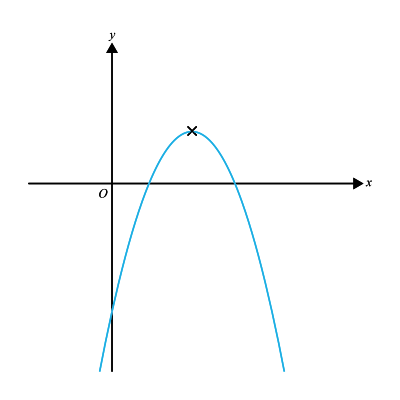
\(y=ax^2+bx+c\)
The given graph above is a maximum point graph.
If the value of \(a<0\), the graph has a maximum point.
Finding the y-Intercept of a Quadratic Graph
A quadratic graph will always have only one y-intercept.
To find the y-intercept, substitute \(x = 0\) and solve for \(y\).
\(y=ax^2+bx+c\)
Putting in \(x = 0\)
We can find the values of the points where the graph cuts the y-axis.
Finding the y-Intercept of a Quadratic Graph
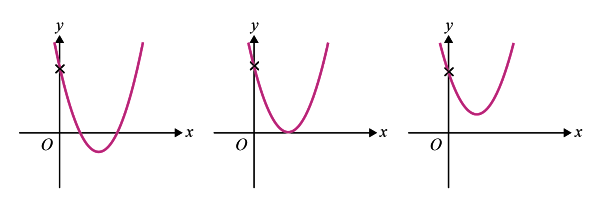
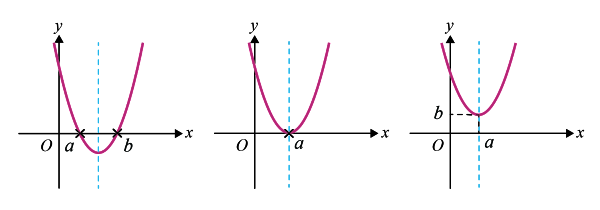
A quadratic graph may have \(2, 1 \;or\; 0\) x-intercepts.
In the first case, as seen, there are two points where the graph cuts off the x-axis.
In the second case, as seen, there is one point where the graph cuts off the x-axis.
In the third case, as seen, there is no point where the graph cuts off the x-axis.
To find the x-intercept, substitute \(y = 0\) and solve for \(x\).
\(y=ax^2+bx+c\)
Putting in \(y = 0\),
We can find the values of the points where the graph cuts the x-axis.
Finding the line of symmetry of a Quadratic Graph
The line of symmetry is the line that passes through \(x\) and splits the entire graph into two mirror halves.
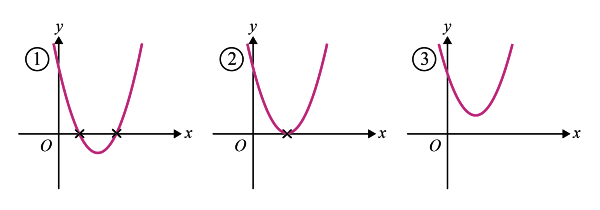
Under this, there are 3 different cases:
Using this simple table below we can find the equation for the line of symmetry
| 2 x-intercepts | 1 x-intercept | No x-intercepts |
|---|---|---|
| \(\displaystyle{x=\frac {a+b}{2}}\) | \(\displaystyle{x=a}\) | \(\displaystyle{x=a}\) |
Finding the turning point of a Quadratic Graph
A turning point is a point on the graph where it changes its direction. It can either be the turning at the highest point or the lowest point.
For every turning point, the x-coordinate always lies on the line of symmetry.
Sketching a Quadratic Graph
In the case of a linear equation graph, we need to know only the x-intercept and the y-intercept to sketch the graph.
However, in the case of Quadratic graphs, you need a few more parameters to sketch the graph.
For a graph given by the formula \(y=ax^2+bx+c\),
Remember the Acronym S I T.
| S | Shape | Coefficient of \(x^2\) |
|---|---|---|
| I | Intercepts | The points of \(x, \;y\) coordinates. |
| T | Turning Point | The maximum or minimum turning point |
Graphs of the form y = (x – h)(x – k)
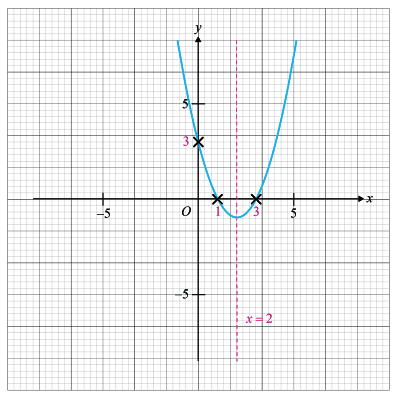
Example: For the graph of \(y= (x-1)(x-3)\) shown above,
| Shape | Since the coefficient of \(x^2\) is \(1\), it is a minimum point graph with an upward parabola |
|---|---|
| x–intercept | Putting \(y=0\); we get \(x=1\) or \(x=3\). |
| Line of symmetry | Upon finding the mean of the x-intercepts you get a line of symmetry. \(\displaystyle{x =\frac {1+3}{2}=2}\) |
| y–intercept | Putting \(\begin{align*} x=0; \;\;y &= (-1)(-3) =3 \end{align*}\) |
Graphs of the form –y = (x – h)(x – k)
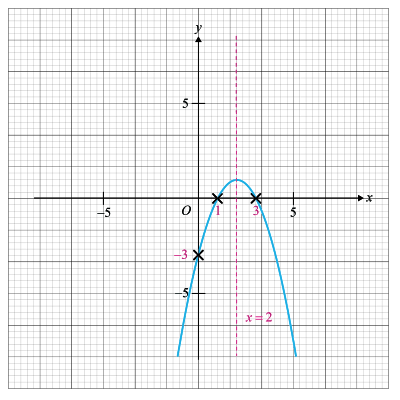
Example: For the graph of \(y= -(x-1)(x-3)\) shown above,
| Shape | Since the coefficient of \(x^2\) is \(-1\), it is a maximum point graph with a downward parabola. |
|---|---|
| x–intercept | Putting \(y=0\); we get \(x=1\) or \(x=3\). |
| Line of symmetry | Upon finding the mean of the x-intercepts you get a line of symmetry. \(\displaystyle{x =\frac {1+3}{2}=2}\) |
| y–intercept | Putting \(\begin{align*} x=0; \;\;y &= -(-1)(-3) =-3 \end{align*}\) |
Question 1:
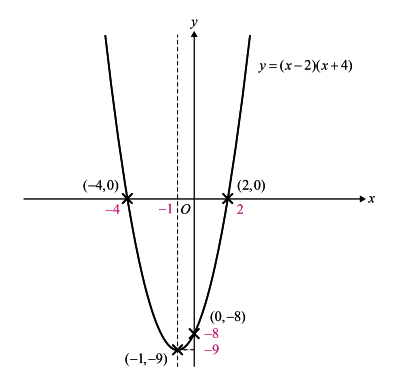
Given the quadratic function \(y = (x - 2)(x + 4)\),
- Find the coordinates of the x-intercepts and y-intercepts.
- State the equation of the line of symmetry of the graph.
- Find the coordinates of the turning point of the graph. State whether it is a maximum or minimum.
- Sketch the graph.
Solution:
The given equation is \(y = (x - 2)(x + 4)\)
- For x-intercepts:
Upon substituting y = 0,
\(\begin{align*} (x - 2)(x + 4) &= 0 \\ \\ \implies\qquad\qquad (x - 2) &= 0\qquad \text{or}\qquad(x +4) = 0 \\ \\ \implies\qquad\qquad\qquad\;\; x &= 2\qquad \text{or}\qquad x = -4 \end{align*}\)
Therefore, there are two x-intercepts obtained: \((2, 0)\) & \((-4, 0)\)
For y-intercepts:
Upon substituting \(x = 0\),
\(\begin{align*} y &= (-2)(4) \\ \\ y &= -8 \end{align*} \)
Therefore, the y-intercept is \((0, 8).\)
- Taking the mean of the x-intercepts,
\(\begin{align*} x &= \frac {2+(-4)}{2} \\ \\ x &= {-2\over2} \end{align*}\)
∴ \(\begin{align*} x= -1 \end{align*}\) is the equation of the line of symmetry of the graph.
- Since for the given equation, the coefficient of \(x^2 > 0\), the graph is an upward opening parabola and has a minimum turning point.
Putting \(x = -1\) in the original equation,
\(\begin{align*} y &= (-1 - 2)(-1 + 4)\\ \\ y &= (-3)(3) \\ \\ y &= -9 \end{align*} \)
Hence the turning point is at \((-1, -9)\).
| S | Upward opening parabola |
|---|---|
| I | x-intercepts \((2, 0 )\) & \((-4, 0 )\) y-intercept \((0,8)\) |
| T | \((-1, -9 )\) |
Conclusion
In this article, we learned how to determine the different parameters of the Quadratic function graphs and sketch graphs of Quadratic functions.
| Continue Learning | |
|---|---|
| Further Trigonometry | Quadratic Equations And Functions |
| Linear Inequalities | Laws of Indices |
| Coordinate Geometry | Graphs Of Functions And Graphical Solution |
| Applications Of Trigonometry | |