Hardest PSLE Maths question and how to solve it (2019 triangle question solved)
")
The most difficult PSLE Maths questions have one thing in common:
They are all testing the student’s ability to apply the concepts that they’ve learned.
In this article, we’ll shed light on the easiest way to solve one of these difficult questions - and also share tips on how to develop a mindset that can make solving similar applied Maths questions a breeze.
So, first things first, what do you do when you come across a difficult question?
- Look for patterns.
- Identify which topic will help you solve this particular problem.
Developing the habit of identifying patterns is difficult, but it can be cultivated with daily practice.
That’s exactly why Geniebook came up with Arena - a free platform where students can team up with their friends to solve daily Maths and Science puzzles to win exciting prizes.
We'll talk more about Arena at the end of this blog, but first, let's get down to business and figure out how to solve this question.
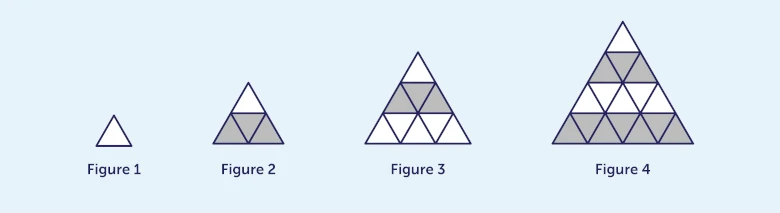
The 2019 PSLE triangle question
| Figure | 1 | 2 | 3 | 4 | 5 |
|---|---|---|---|---|---|
| White triangles | 1 | 1 | 6 | 6 | |
| Grey triangles | 0 | 3 | 3 | 10 | |
| Total |
Question A: Fill in the table above.
Question B: Find the total number of grey and white triangles for figure 250.
Question C: Find the percentage of grey triangles in figure 250.
As mentioned earlier, let’s find our patterns.
If you look closely, there’s a single white triangle at the top of all figures, after that you’ll notice 3 grey triangles, followed by 5 white triangles, and so on.
This means each subsequent line has 2 more triangles than the one above it.
That’s it!
That’s your first pattern.
Now, let’s look at the first question we need to figure out how to complete the table that’s given.
First, let’s do the easiest task and fill in the total:
| Figure | 1 | 2 | 3 | 4 | 5 |
|---|---|---|---|---|---|
| White triangles | 1 | 1 | 6 | 6 | |
| Grey triangles | 0 | 3 | 3 | 10 | |
| Total | 1 | 4 | 9 | 16 |
Now that we’ve done the easy part, we must now find the number of white triangles in figure 5.
If we look at triangle 4, the last line is grey, and it has 7 triangles.
This means, in triangle 5, the next line will be white, which will have (7+2) = 9 triangles.
So, the total number of white triangles in figure 5 will be: 6 (total number of white triangles in figure 4) + 9 = 15.
In figure 5, since only one new white line is added, the number of grey triangles will be the same for figures 4 and 5, which is 10.
And the final result will be 15 + 10 = 25.
So, the complete table will look like this:
| Figure | 1 | 2 | 3 | 4 | 5 |
|---|---|---|---|---|---|
| White triangles | 1 | 1 | 6 | 6 | 15 |
| Grey triangles | 0 | 3 | 3 | 10 | 10 |
| Total | 1 | 4 | 9 | 16 | 25 |
Now, let’s move on to the next question, which is to find the total number of grey and white triangles for figure 250.
Notice that multiplying the figure number by itself gives you the total number of triangles.
This means,
For figure 2: 2 x 2 = 4
For figure 3: 3 x 3 = 9
For figure 4: 4 x 4 = 16
So, for figure 250, the total number of squares would be 250 x 250 = 62500.
Now, for the last question, we need to find the percentage of grey triangles in figure 250.
Take a look at the image given in the question again.
We see that figures 1 and 3 have more white triangles, and figures 2 and 4 have more grey triangles.
This means that odd-numbered figures will have more white triangles, and even-numbered triangles will have more grey triangles.
Since fig. 250 is an even number, it will have more grey triangles.
How many more?
Let’s look at the image given in the question again.
In figure 2, the difference between the number of white triangles (1) and grey triangles (3) is 2 (3-1).
In figure 3, the difference between the white (6) and grey (3) triangles is 3.
We see a similar pattern for Figures 4 and 5.
This means that for figure 250, the difference between white and grey triangles will be 250.
Ok, so now let’s collect all of the information that we know for figure 250 in one place:
- The total number of triangles is 62500.
- There are more grey triangles than white triangles.
- The difference between grey triangles and white triangles is 250.
So we can say that:
Grey triangles + White triangles = 62500
Since we know that the difference between grey triangles and white triangles is 250, we can say that:
Grey triangles + white triangles = 250.
This means, that for our original formula,
(250 + white triangle) + white triangles =62500.
So, the number of white triangles would be (62500-250)/2=31125
And the number of grey triangles would be 31125 + 250 = 31375.
Now, as we mentioned in our article on how to avoid careless Maths mistakes, let’s double-check our work to see if our calculations are correct.
We calculated that figure 250 would have 31375 grey triangles and 31125 white triangles, which should total 62500. That’s correct, so we are sure we are on the right track!
Now, let’s calculate the percentage between grey and white triangles.
We’ve written in detail here about how to calculate percentages here.
But, to calculate the number of grey triangles, our formula will be:
(Total number of grey triangles/total number of triangles) * 100 = 50.2%, which is the correct answer.
Doesn’t it all make sense when it’s explained?
If you’d like more practice solving Maths problems, try Geniebook Arena!
Students can team up with their friends to strive to win a daily battle against difficult Maths and Science questions.
The rules are simple: invite your friends, form a team, and battle your way up the global leaderboard.
Each participant will be shown a total of five Maths or Science questions, depending on the subject of the day.
For every right answer, your child earns bubbles (digital tokens) that can be used to redeem kid-friendly items from Geniebook’s Bubble Store.
The best part, Arena is free-to-play.
Sign up today by clicking on this link.