Quadratic Functions In Real-World Context
In this article, we will be talking about the Quadratic Functions and their application in a real world context. We will be discussing about
- conditions for the Quadratic curve to lie completely above or below the x−axis.
- modelling real−world situations using quadratic functions.
This article is specifically written to serve the requirements for Secondary 3 Additional Mathematics syllabus in Singapore.
Completing the Square
Question 1:
Express the equation \(2x^2 -8x +10\) in the form \(a(x-h)^2+k \).
Solution:
We will need to factorise the coefficient of \(x^2\) before we can complete the square.
\(2x^2-8x+10=2[x^2-4x+5]\)
To complete the square, we need to express in the form of \(a^2-2ab+b^2\). To do so, we will half the value of the coefficient of \(x\) to obtain the value of \(b\). To maintain the equality of the expression, we will add another \(−2^2\) term to neutralise the term that we have added.
\(\begin{align} &2[x^2-4x\; \overbrace{+\;2^2-2^2\;+}^0\;5]\\ &\quad^\underbrace{\qquad\qquad\quad}\\ &= 2[(x-2)^2-2^2+5]\\ &= 2[(x-2)^2+1]\\ &=2(x-2)^2+2 \end{align}\)
Sketching Graphs of Quadratic Function
Sketching Quadratic Functions in the form \(a(x-h)^2+k \).
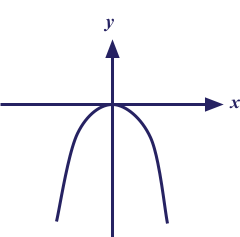
When we sketch a Quadratic graph for the function \(y=a(x-h)^2+k \) with the value of \(a<0\) then we have a downward open parabola. You can remember it as the n−shaped graph that has a maximum point. Below is an example of a quadratic graph with \(a<0\) with \(h=0,k=0\).
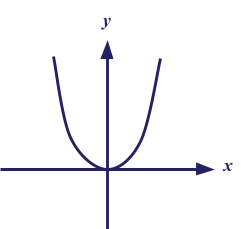
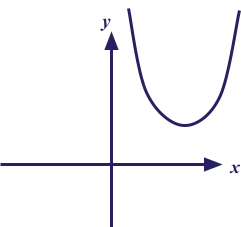
However, when we sketch the same graph for a positive value of \(a\), where \(a=3\), in that case, the graph obtained is an upward open parabola. You can remember it as a u−shaped graph that has a minimum point. Below is an example of a quadratic graph with \(a>0\) with \(h=0,k=0\).
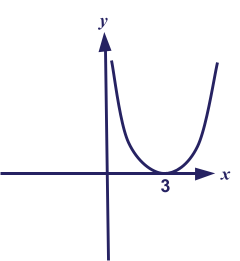
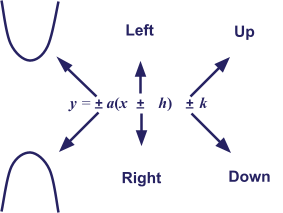
Let’s consider the u−shaped graph given above. When we change the value of \(h \), we see there is a change in the position of the graph along the x−axis. When the value of \(h \) is positive the graph shifts towards the positive x−axis or towards the right of the graph.
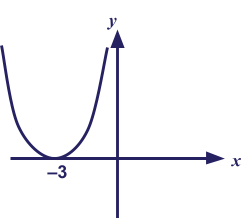
When the value of \(h \) is negative, it shifts towards the negative x−axis which is towards the left of the graph.
However, when the value of \(k\) changes it makes the graph shift along the y−axis.
A positive value of \(k\) makes the graph shift along the positive y−axis or upwards and a negative value of \(k\) shifts the graph towards the negative y−axis or in a downwards direction.
You can summarise the entire point using this image:
Question 2:
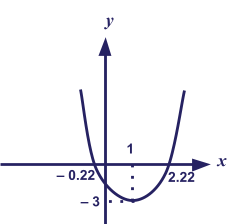
Sketch the graph of \(y=2(x-1)^2-3\), indicating clearly the coordinates of the turning point and the values where the graph crosses the x & y−axes.
Solution:
Let us look at the information that has been provided to us.
\(y=2(x-1)^2-3\)
Upon looking at the equation, we get the value of \(a=2, h=1\) & \(k=-3\).
Looking at the value of \(a\), we understand immediately that our graph will be an upward open parabola graph.
The values of \(h\) and \(k\) show that the graph will shift by 1 point towards the right along the positive \(x\)−axis and downwards by 3 points along negative \(y\) direction. Hence, the minimum point of the graph will naturally be at (1,−3).
To find the \(y\)−intercept for this we can simply take the equation and substitute \(x=0\).
\(\begin{align} &y =2(x-1)^2-3\\ &y =2(0-1)^2-3\\ &y =2-3\\ &y =-1 \end{align}\)
Therefore, the y−intercept is \(−1\).
Similarly for x−intercept substituting \(y=0\) results in
\(\begin{align} &y =2(x-1)^2-3\\ &0 =2(x-1)^2-3\\ &3 =2(x-1)^2\\ &1.5 =(x-1)^2 \\ &(x-1)^2 =1.5\\ &(x-1) =\sqrt{1.5}\\ &x = 1 \pm 1.22\\ &x = 2.22 \qquad\text{or}\qquad -0.22 \end{align} \)
Example 1:
Without sketching the graph, explain whether \(y = -2x^2+4x -5\) lies completely above or below the x−axis.
Solution:
First, we need to convert the equation into the square form by completing the square.
\(\begin{align} &y = -2x^2+4x -5\\ &y = -2[x^2-2x +2.5]\\ &y = -2[x^2-2x+1^2-1^2 +2.5]\\ &y = -2[(x-1)^2-1^2 +2.5] & \text{(upon dividing coefficient of x by 2)}\\ &y = -2[(x-1)^2+1.5]\\ &y = -2(x-1)^2-3\\ \end{align}\)
- Now that we have obtained the square form, we see the shape of the graph as n−shaped since the value of \(a=-2\), which is negative.
- Then we find out the maximum point coordinates by looking at the values of \(h\) and \(k\) obtained when we compare the obtained equation with the standard equation.
- The value of \(h=1\) and hence the graph shifts right along \(x\)−axis by 1 point.
- The value of \(k=-3\) and hence the graph shifts down by 3 points.
Since the graph of \(y = -2x^2+4x -5\) has maximum point at (1, 3), hence the curve lies completely below the \(x\)−axis.
Question 3:
Without sketching the graph, explain whether \(y=3x^2 +12x +17\) lies completely above or below the x−axis.
Express \(y=3x^2 +12x +17\) in the form \(y=a(x+h)^2+k \).
Solution:
\(\begin{align} &y =3x^2 +12x +17\\ &y =3[x^2 +4x +\frac{17}{3}]\\ &y =3[(x+2)^2-2^2+\frac{17}{3}]\\ &y =3[(x+2)^2+ 1\frac{2}{3}]\\ &y =3(x+2)^2+5\\ \end{align}\)
Question 4:
Without sketching the graph, explain whether \(y=3x^2 +12x +17\) lies completely above or below the \(x\)−axis. Which of the following statements is true?
- Since, the graph of \(\begin{align} y = 3x^2+12x+17 \end{align}\) has a maximum point of \((-2,5)\), the curve cuts the x-axis at two distinct points.
- Since, the graph of \(\begin{align} y = 3x^2+12x+17 \end{align}\) has a minimum point of \((-2,5)\), the curve lies completely above the x-axis.
- Since, the graph of \(\begin{align} y = 3x^2+12x+17 \end{align}\) has a minimum point of \((-2,5)\), the curve lies completely below the x-axis.
- Since, the graph of \(\begin{align} y = 3x^2+12x+17 \end{align}\) has a maximum point of \((-2,5)\), the curve lies completely below the x-axis.
Solution:
- Since we already have the square form of the equation, \(y=3(x+2)^2+5\) from the previous question.
- From the equation, \(a=3\) means that the graph is an upward open parabola or u−shaped graph and has a minimum point.
- The \(h=-2\), shows the graph is moving 2 units towards the left from origin and the \(k=5\) shows the graph is completely above the x−axis and the minimum point of the graph is \((-2,5)\).
- Hence, the graph Option B is correct.
Modelling real−world situations with Quadratic functions
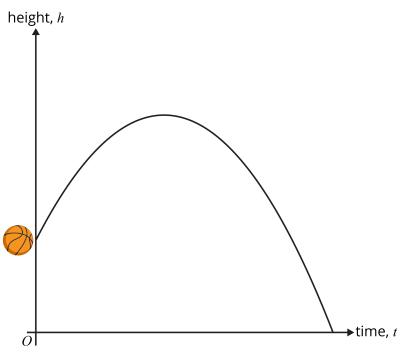
Quadratic functions are useful for modelling some real−world situations such as projectile motion, shape of objects, & profit functions in economics.
Example 2:
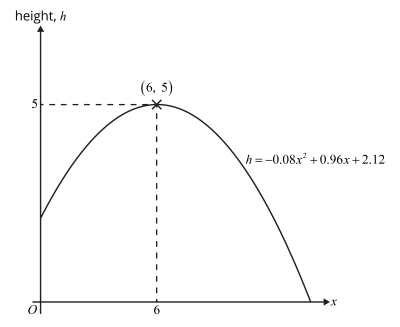
The height from the ground, \(h\) metres, of a shuttlecock hit by a boy using a badminton racket can be modelled by the equation \(\displaystyle{h=-0.08x^2 + 0.96x +2.12}\) where \(x\) is the horizontal distance travelled by the shuttlecock in metres.
- Find the greatest height reached by the shuttlecock and the corresponding horizontal distance travelled.
Solution:
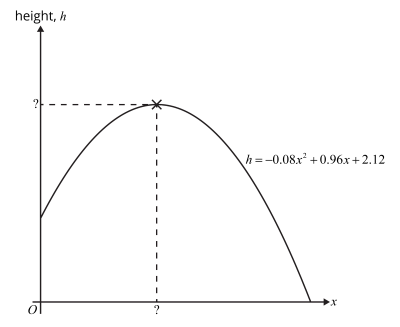
First, we need to convert the equation into square form,
\(\begin{align} &h=-0.08x^2 + 0.96x +2.12\\ &h =-0.08[x^2 -12x -26.5]\\ &h =-0.08[(x-6)^2-6^2-26.5] & \text{(upon dividing coefficient of x by 2)}\\ &h =-0.08[(x-6)^2 -62.5]\\ &h =-0.08(x-6)^2 +5\\ \end{align}\)
Since \(a=-0.08\), therefore the graph is n−shaped and has a maximum point with the coordinates \((6,5)\).
Thus, the maximum height the shuttlecock reaches is \(5 \;m\) and the horizontal distance reached is \(6 \;m\).
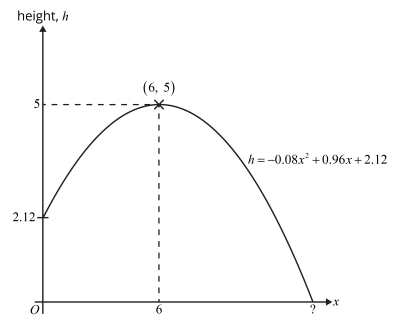
- Find the height of the shuttlecock when it first made contact with the racket.
Solution:
Ideally, the shuttlecock would be hit at a height which would be the y−intercept of the shuttlecock’s path.
To find the y−intercept of the quadratic graph we simply substitute \(x=0\) in the equation,
\(\begin{align} &h =-0.08x^2 + 0.96x +2.12\\ &h =-0.08(0)^2 + 0.96(0) +2.12\\ \ &h = 2.12\;m\\ \end{align}\)
- The entire length of the badminton court is \(13.4 \;m\). Given that the boy stands on one end of the badminton court, will the shuttlecock travel beyond the badminton court? Justify your answer with calculation.
Solution:
When we look at the graph, we understand that the point where the shuttlecock drops is the x−intercept of the graph which can be calculated by substituting \(h=0\).
\(\begin{align*} &h=-0.08x^2 + 0.96x +2.12 \\ &0 =-0.08(x-6)^2 +5 \\ &0.08(x-6)^2 =5 \\ &(x-6)^2 =\frac{5}{0.08} \\ &(x-6) = \pm\sqrt{\frac{5}{0.08}} \\ &(x-6) = \pm\sqrt{62.5} \\ &x = 6\pm {\sqrt{62.5}} \\ &x = 13.9 \qquad \text{or} \qquad -1.91 \end{align*}\)
Since distance travelled cannot be negative, hence the positive value is taken in consideration.
The length of the court is \(13.4 \;m\) and the shuttlecock travels \(13.9 \;m\) which is beyond the court.
Conclusion
In this article, we have learned about the conditions for quadratic curves to lie completely above or below the x−axis. We have also learnt how to complete the square of quadratic function and obtain their Maximum or Minimum point respectively.
We also looked at how to model real−world situations using quadratic functions such as projectile motion. Practising questions related to this concept will help you in developing a good understanding of the topic.
Keep learning! Keep improving!
| Continue Learning | |
|---|---|
| Quadratic Functions in Real-World Context | Equations and Inequalities |
| Logarithmic Functions | Surds |
| Polynomials & Cubic Equations | Partial Fraction |
| Exponential Functions | Coordinate Geometry (Circles) |
| Linear Law | Binomial Theorem |