Line Graphs
What are Line Graphs?
Line Graphs are used to represent information or data that changes over a period of time. They are drawn by connecting several points using straight lines.
In this article, the learning objectives are:
- Interpreting values and solving problems
Interpreting Values And Solving Problems
Question 1:
The line graph shows the number of tourists who visited the Singapore Indoor Stadium over a period of 4 years.
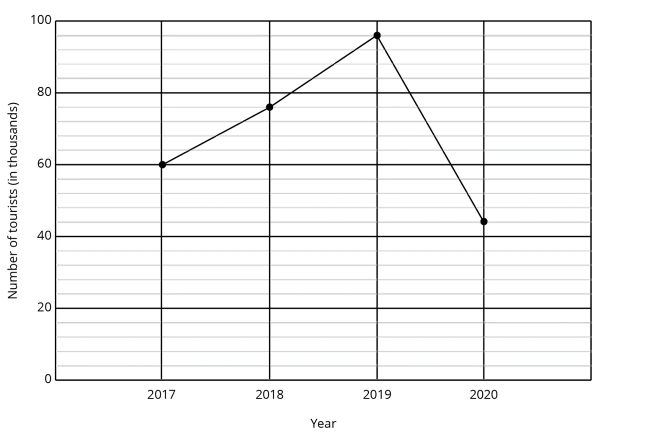
A. What is the value of each interval?
Solution:
There are 5 intervals from 0 to 20.
Value of 5 intervals \(= 20 \,000\)
Value of 1 interval
\(= 20\,000 ÷ 5 \)
\(= 4000\)
Answer:
\(4000\)
B. How many tourists visited the Singapore Indoor Stadium in 2018?
Solution:
Value of 4 intervals
\(= 4 \times 4000\)
\(= 16 \,000\)
Number of tourists in 2018
\(= 60 \,000 + 16 \,000\)
\(= 76 \,000\)
Answer:
\(76 \,000\) tourists
C. What was the decrease in the number of tourists who visited the Singapore Indoor Stadium from 2019 to 2020?
Solution:
Value of 4 intervals
\(= 4 \times 4000\)
\(= 16 \,000\)
Number of tourists in 2019
\(= 80 \,000 + 16 \,000\)
\(= 96 \,000\)
Number of tourists in 2020
\(= 40 \,000 + 4000\)
\(= 44 \,000\)
Decrease in the number of tourists from 2019 to 2020
\(= 96 \,000 − 44 \,000\)
\(= 52 \,000\)
Answer:
\(52 \,000\) tourists
Question 2:
The line graph shows the amount of money Potter saves each month from July to December.

A. In which month did he save the least?
Answer:
October
B. How much did he save from July to November?
Solution:
Total amount of savings from July to November
\(= $450 + $900 + $650 + $150 + $300\)
\(= $2450\)
Answer:
\($2450\)
C. How much more did he save in August than in December?
Solution:
Difference between the amount of savings in August and in December
\(= $900 − $500\)
\(= $400\)
Answer:
\($400\)
Question 3:
The line graph shows the number of visitors to the museum over 6 months.
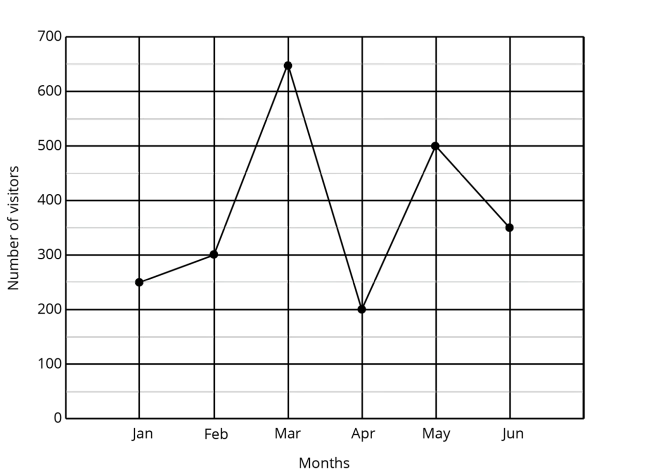
A. In which month was the number of visitors the most?
Answer:
March
B. What is the increase in the number of visitors from April to May?
Solution:
Number of visitors in April \(= 200\)
Number of visitors in May \(= 500\)
Increase in the number of visitors from April to May
\(= 500 − 200\)
\(= 300\)
Answer:
\(300\) visitors
C. In which month was the number of visitors twice the number of visitors in January?
Solution:
There are 2 intervals from 0 to 100.
Value of 2 intervals \(= 100 \)
Value of 1 intervala
\(= 100 \div 2 \)
\(= 50\)
Number of visitors in Jan \(= 250\)
Number of visitors in Feb \(= 300\)
Number of visitors in Mar \(= 650\)
Number of visitors in Apr \(= 200\)
Number of visitors in May \(= 500\)
Number of visitors in Jun \(= 350\)
Number of visitors that is twice of Jan
\(= 2 \times 250\)
\(= 500\)
Answer:
May
Question 4:
The line graph shows the amount that Kelly saved over a period of five months.

A. In which month did she save the least?
Answer:
January
B. Between which \(2\) months was there a decrease in her savings?
Answer:
Between March and April
C. In which month did she save \(3\) times as much as she saved in January?
Solution:
There are \(2\) intervals from \(0\) to \(10\).
Value of \(2\) intervals \(= $10 \)
Value of 1 intervala
\(= $10 \div 2 \)
\(= $5\)
Kelly’s savings in Jan \(= $10\)
Kelly’s savings in Feb \(= $20\)
Kelly’s savings in Mar \(= $40\)
Kelly’s savings in Apr \(= $15\)
Kelly’s savings in May \(= $30\)
Amount of savings that is 3 times as much as savings in Jan
\(= 3 \times $10\)
\(= $30\)
Answer:
May
Question 5:
The line graph shows the amount of petrol left in a car and the distance it had travelled.

How much petrol was used for the first 90 km?
- 10 ℓ
- 20 ℓ
- 30 ℓ
- 50 ℓ
Solution:
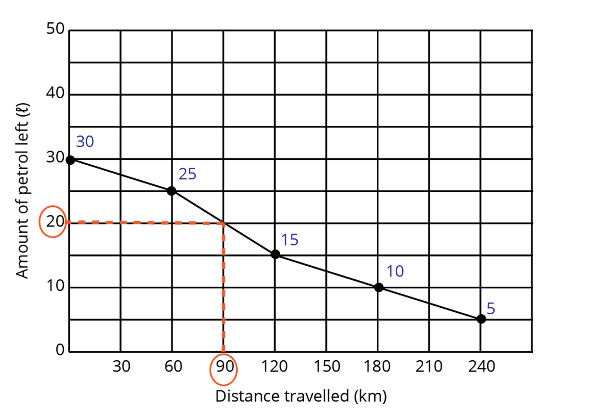
At 90 km, 20 ℓ of petrol was left.
At 0 km, before the car moved, there was 30 ℓ.
Amount of petrol used
\(= 30 \,ℓ − 20 \,ℓ\)
\(= 10 \,ℓ \)
Answer:
(1) \(10 \,ℓ \)
Question 6:
The line graph shows the number of visitors to the zoo over a period of 5 weeks.

What was the greatest increase in the number of visitors to the zoo?
- 5
- 50
- 400
- 500
Solution:
Number of visitors in Week 1 \(= 600\)
Number of visitors in Week 2 \(= 400\)
Number of visitors in Week 3 \(= 900\)
Number of visitors in Week 4 \(= 1000\)
Number of visitors in Week 5 \(= 1400\)
The greatest increase in the number of visitors is between Week 2 to Week 3.
Greatest increase in the number of visitors
\(= 900 - 400\)
\(= 500\)
Answer:
(4) \(500\)
Question 7:
The line graph shows the number of people in a supermarket from 2 pm to 8 pm.

During which hourly interval was there the greatest decrease in the number of people?
- 2 pm - 3 pm
- 3 pm - 4 pm
- 6 pm - 7 pm
- 7 pm - 8 pm
Solution:
To find the greatest increase, we find the steepest slope that is going upwards.
To find the greatest decrease, we find the steepest slope that is going downwards.
Since the question is asking for the greatest decrease, we will only focus on those parts that are downward-sloping.

Answer:
(4) 7 pm - 8 pm
Question 8:
Three objects, X, Y and Z were placed in Container C, one after the other. The line graph shows the mass of the container and objects.
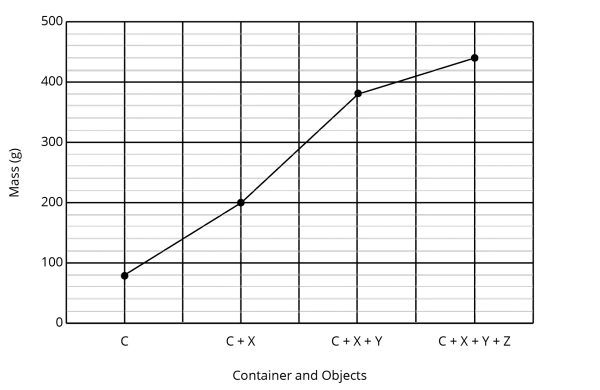
Which object is lighter than the container?
- Object X
- Object Y
- Object Z
Solution:
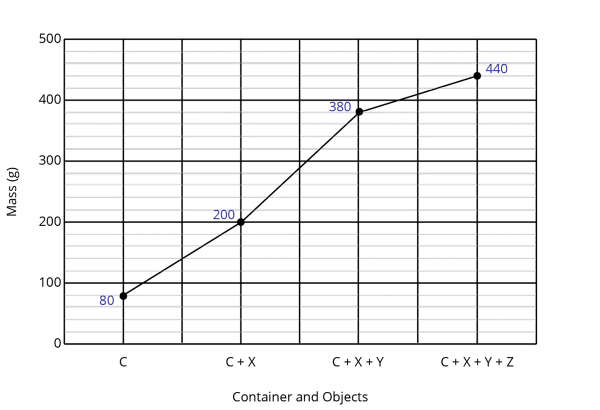
There are 5 intervals from 0 to 100.
Value of 5 intervals \(= 100 \text{ g}\)
Value of 1 interval
\(= 100 \text{ g} \div 5 \)
\(= 20 \text{ g}\)
The value of each interval is \(20 \text{ g}\).
Mass of Container C
\(=\) Value of 4 intervals
\(= 4 \times 20 \text{ g}\)
\(= 80 \text{ g}\)
Mass of Container C and Object X \(= 200 \text{ g}\)
Mass of Object X
\(= 200 \text{ g} − 80 \text{ g}\)
\(= 120 \text{ g}\)
ass of Container C, Object X and Object Y
\(= 300 \text{ g} + 80 \text{ g}\)
\(= 380 \text{ g}\)
Mass of Object Y
\(= 380 \text{ g} − 200 \text{ g}\)
\(= 180 \text{ g}\)
Mass of Container C, Object X, Object Y and Object Z
\(= 400 \text{ g} + 40 \text{ g}\)
\(= 440 \text{ g}\)
Mass of Object Z
\(= 440 \text{ g} − 380 \text{ g}\)
\(= 60 \text{ g}\)
Answer:
(3) Object Z
Watch Our Video Lesson!
| Continue Learning | |
|---|---|
| Multiplication | Whole Numbers |
| Multiplication And Division | Decimals |
| Model Drawing Strategy | Division |
| Fractions | Factors And Multiples |
| Area And Perimeter 1 | Line Graphs |
| Conversion Of Time | |