Speed Of Reaction
In this article, we will learn about the Speed of Reaction. We will cover the following learning outcomes as laid out in the syllabus for Upper Secondary Chemistry:
- Understand that reactions can occur at different speeds.
- Describe the different methods that can be used to investigate the speed of reaction.
Different Speeds Of Reaction
Different chemical reactions occur at different speeds. Some reactions can occur within split seconds, while others can take months or years to take place.
Look at the following reactions. Can you tell which is the fastest and which is the slowest?
|
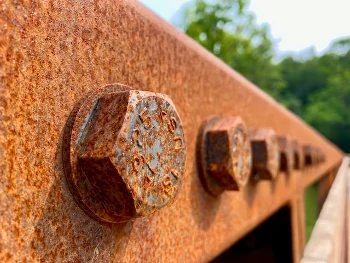
1. Rusting Of Iron
Image Credit: unsplash - Charlie Wollborg |
2. Potassium With Water
Image Credit: flickr - Cyberchemist |
|
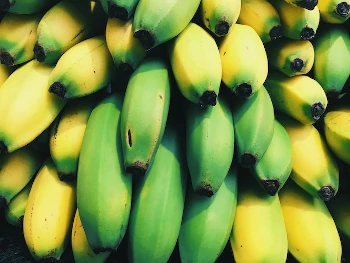
3. Ripening Of Fruits
Image Credit: Scott Webb - unsplash.com |
|
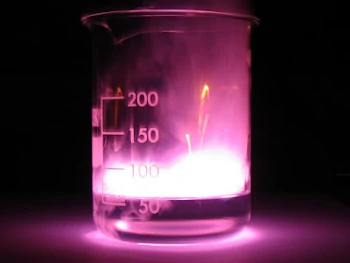
- The reaction of potassium with water is the fastest. This reaction is also very vigorous and explosive.
- The ripening of fruits such as bananas can take place within 2 to 3 days.
- The rusting of iron in air is the slowest reaction. It usually occurs over several months.
Speed Of Reaction And Time
The speed of reaction tells us how fast or how slow a reaction is. The speed of reaction is inversely proportional to time.
- When the speed of reaction is fast, the chemical reaction takes a shorter time to complete.
- When the speed of reaction is slow, the chemical reaction takes a longer time to complete.
How do we calculate the speed of reaction?
It can be determined by calculating the rate of chemical change or measured quantity in a chemical change per unit time.
\(\displaystyle{\small \textsf{Speed Of Reaction} =\frac{\textsf{Measured Quantity}}{ \textsf{Time}} }\)
The chemical changes depend on the nature of the reaction, such as formation of bubbles due to gaseous products formed, colour change or even pH change.
We will focus on measuring the speed of reaction when the reaction produces a gas.
Hence, we can measure either the volume of gas produced in the reaction or the mass of the reactants that remain at regular time intervals.
Measuring Volume Of Product (Gas) Formed
When a reaction produces a gas, we can measure the speed of the reaction by measuring the volume of gas produced and collected in a gas syringe per unit time.
\(\displaystyle{\small \textsf{Speed Of Reaction} =\frac{\textsf{Volume Of Gas}}{ \textsf{Time}}}\)
Let us look at an example. Magnesium reacts with dilute hydrochloric acid according to the equation below.
\(\small \mathsf{Mg \,(s) + 2HCl \,(aq)} \xrightarrow[]{\quad} \mathsf{MgCl_2 \,(aq) + H_2 \,(g)}\)
This reaction produces hydrogen gas. By measuring the rate at which hydrogen gas is formed and collected in a gas syringe, we can measure the speed of the reaction. The apparatus for measuring the speed of this reaction is as shown below.
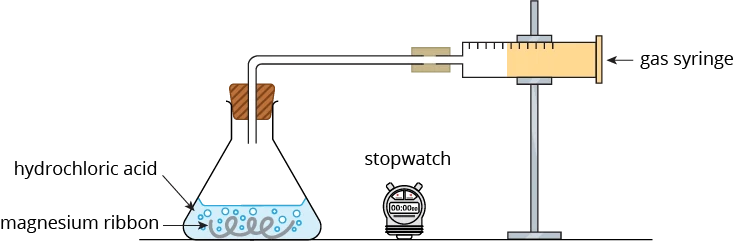
At 1 minute intervals, the volume of hydrogen gas collected in the syringe is measured and recorded.
From the results, a graph of volume of hydrogen gas produced against time is plotted.
Graph Interpretation
The graph plotted is as shown below.
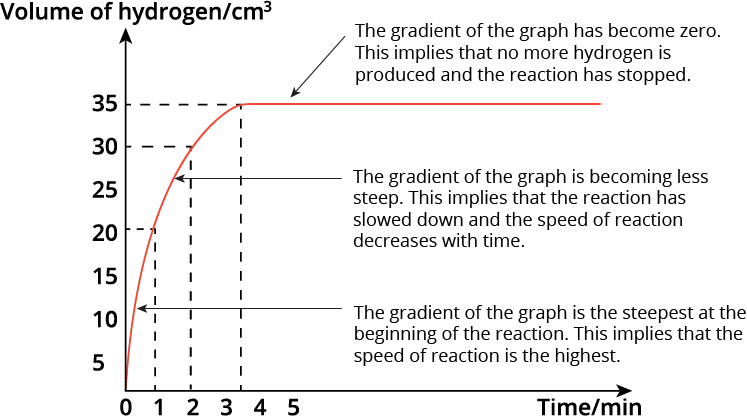
We observe that the volume of hydrogen gas produced increases as the reaction proceeds.
The gradient of the graph tells us the speed of the reaction. The steeper the gradient, the faster the reaction.
The gradient of the graph is the steepest at the beginning of the reaction. This implies that the speed of reaction is the highest.
As the reaction proceeds, the gradient of the graph becomes less steep. This implies that the reaction has slowed down and the speed of reaction is decreasing with time.
At 3.5 minutes, the gradient of the graph has become zero i.e. the graph becomes horizontal. This implies that no more hydrogen gas is produced and collected. The reaction has stopped. The total volume of hydrogen gas produced is 35 cm\(^3\).
The reaction stops when one of the reactants (i.e. the limiting reactant) is completely used up.
How do we determine the time taken for the reaction to be completed halfway through (i.e. half of the reactant has reacted)?
When half of the reactant has reacted, then half of the total amount of the product will be formed (using stoichiometry).
Since the total volume of hydrogen gas collected when the reaction is completed is 35 cm\(^3\), then half the volume of hydrogen gas produced will be 17.5 cm\(^3\). Using the graph, we can identify the time taken for that volume of hydrogen gas to be produced, which is approximately 0.5 minutes.
Measuring Rate Of Mass Loss
The speed of a reaction that produces a gas can also be measured by measuring the rate of mass loss.
Let us look at an example. Calcium carbonate is reacted with dilute hydrochloric acid according to the equation below.
\(\small \mathsf{CaCO_3 \,(s) + 2 HCl \,(aq)}\) \(\xrightarrow[]{\quad}\) \(\small{ \mathsf{CaCl_2 \,(aq) + CO_2 \,(g) + H_2O \,(l)}}\)
The apparatus for measuring the speed of this reaction is as shown below.
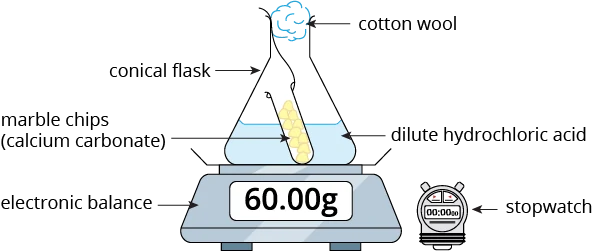
In this reaction, carbon dioxide gas is produced. This gas will escape from the flask, resulting in a decrease in the mass of the reaction mixture.
In this set-up, a ball of cotton wool is placed in the mouth of the conical flask to prevent acid spray, while allowing the carbon dioxide gas to escape. This is to ensure that the change in the mass of the reaction mixture is only due to the loss of the gas.
The mass of the conical flask and its contents is measured using an electronic balance at 1-minute intervals.
From the results, a graph of the mass of the conical flask and its contents against time is plotted.
Graph Interpretation
The graph plotted is as shown below.
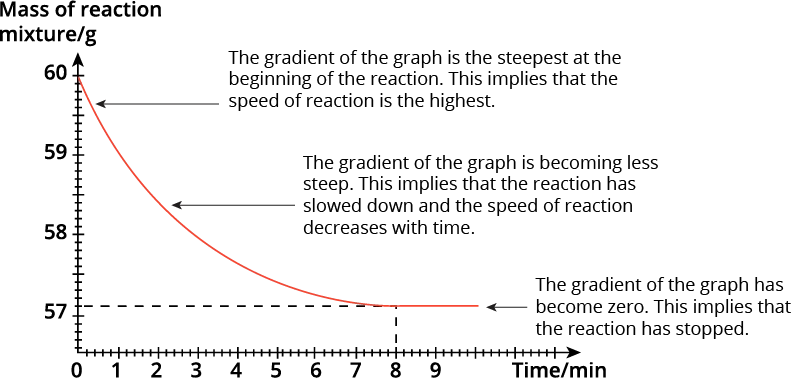
We observe that the mass of the conical flask and its contents decreases as the reaction proceeds.
The change in the mass of the reaction mixture over time can allow us to determine the speed of the reaction. The steeper the gradient, the faster the reaction.
From the graph, we can see that the gradient of the graph is the steepest at the beginning of the reaction. This implies that the speed of reaction is the highest.
As the reaction proceeds, the gradient becomes less steep. This implies that the reaction has slowed down and the speed of the reaction decreases with time.
At 8 minutes, the gradient of the graph becomes zero i.e. the graph becomes horizontal. This implies that the reaction has stopped. The final mass of the conical flask and its contents is 57.1 g.
\(\begin{align} \small{ \textsf{Total decrease in the mass}} &= \small{\textsf{initial mass} - \textsf{final mass}}\\[2ex] &= \small{60 \textsf{ g} - 57.1 \textsf{ g}}\\[2ex] &= \small{2.9 \textsf{ g}} \end{align}\)
Question 1:
A student measured the rate of the reaction between marble chips \(\mathsf{CaCO_3}\), and dilute hydrochloric acid.
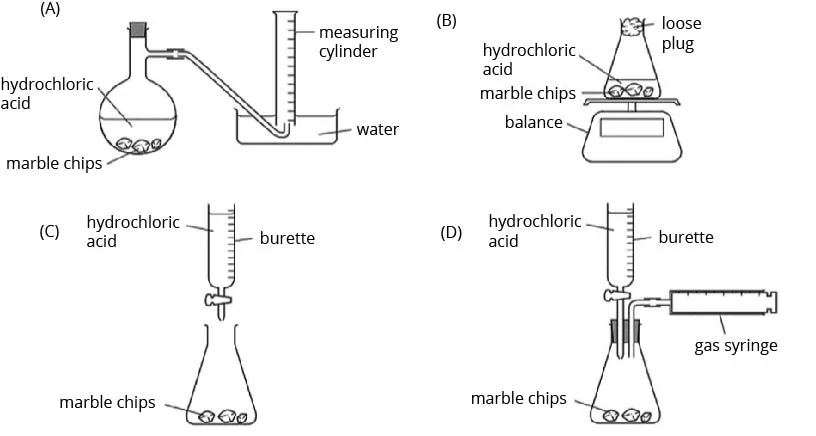
Which diagrams show the apparatus that are suitable for this experiment?
- A and B
- A, B and D
- B and C
- B, C and D
Solution:
(B) A, B and D
Explanation:
We can measure the rate of a reaction by the rate of product formed or the rate of mass loss. In this reaction, carbon dioxide gas is produced. Hence, the rate of product formed can be measured by collecting and measuring the volume of carbon dioxide gas produced over time, either using the displacement of water method (diagram A) or the gas syringe (diagram D).
Diagram B shows how we can measure the rate of reaction by measuring the rate of mass loss. The carbon dioxide produced will escape from the flask into the atmosphere, hence causing a decrease in the mass of the flask with the contents.
Question 2:
The graph below shows how the total volume of hydrogen, produced by the reaction between hydrochloric acid and an excess of magnesium, varies with time.
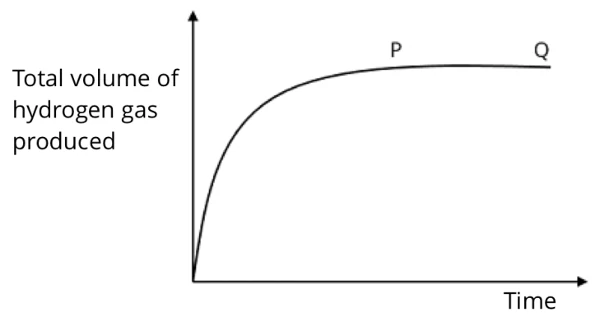
Which of the following statements about section PQ of the curve is correct?
- The reaction is continuing at a constant rate.
- The rate of production of hydrogen is at a maximum.
- All the magnesium has reacted.
- No more hydrogen is being produced.
Solution:
(D) No more hydrogen is being produced.
Explanation:
The gradient of the curve at section PQ flattens/ becomes zero, which implies that the reaction has stopped/completed. Thus, no more hydrogen is being produced at this point. This happens when the hydrochloric acid has been completely used up, since it is the limiting reactant (*magnesium is in excess).
Question 3:
A student adds marble chips to hydrochloric acid. Which graph of mass of flask against time shows the result?
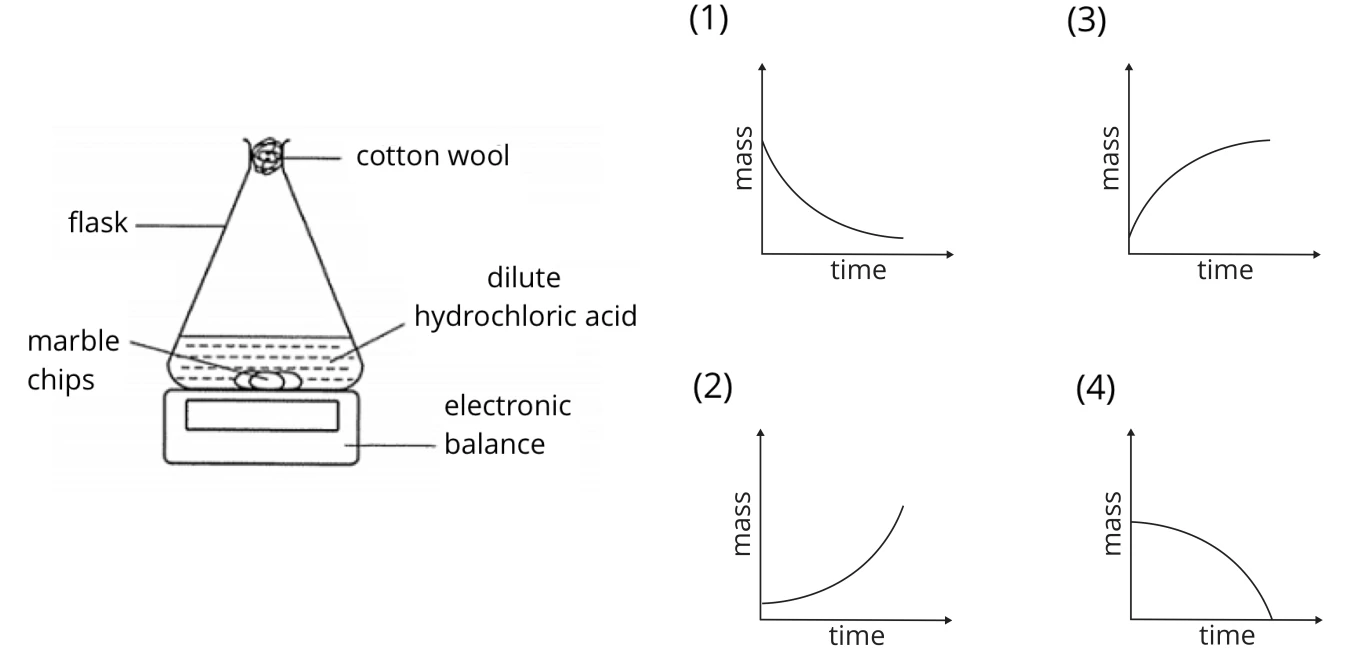
Solution:
(1)
Explanation:
The marble chips (also commonly known as calcium carbonate) react with dilute hydrochloric acid to form salt, water and carbon dioxide. The carbon dioxide gas that is produced in this reaction escapes from the flask, thus resulting in a decrease in the total mass of the flask and contents.
The speed of reaction is the fastest at the beginning as the concentration of the reactants is the highest. Hence, the gradient of the graph at the beginning is the steepest. As the reaction progresses, the reaction slows down as the concentration of the reactants is gradually decreasing. Hence, the gradient of the graph will become less steep.
Question 4:
In a reaction, calcium carbonate in a flask is placed on an electronic balance. Dilute hydrochloric acid is added and cotton wool is placed at the mouth of the flask. The total mass of the reacting flask is recorded every five seconds. The diagram below shows the results of the reaction.

At which time is the reaction fastest?
- 5 s
- 10 s
- 15 s
- 20 s
Solution:
(A) 5 s
Explanation:
The reaction is the fastest at the beginning of the reaction, as the concentration of the reactants is the highest. It can be inferred from the gradient of the graph, as the gradient of the graph is the steepest at the beginning.
Question 5:
When an excess of copper(II) carbonate reacts with dilute sulfuric acid, the reaction becomes slower gradually. It finally stops. Which of the following reasons best explains why this happens?
- The copper(II) carbonate is coated with insoluble salt.
- The copper(II) carbonate does not react well with dilute sulfuric acid.
- The copper(II) carbonate has caused the acid to be used up completely.
- The copper(II) carbonate has completely been used up in the reaction.
Solution:
(C) The copper(II) carbonate has caused the acid to be used up completely.
Explanation:
The speed of reaction is the fastest at the beginning because the concentration of the reactants is the highest. The reaction then starts to slow down as the concentration of the reactants gradually decreases, until the limiting reactant is completely used up, and the reaction will come to a stop. In this experiment, the limiting reactant is dilute sulfuric acid. Hence, the reaction stops when the dilute sulfuric acid is completely used up.
Question 6:
The rate of reaction between a given mass of calcium carbonate and an excess of hydrochloric acid is studied by collecting the carbon dioxide gas produced in a graduated syringe. The results are shown in the graph below.
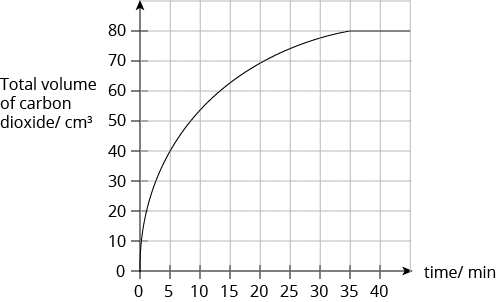
How much time is required for half of the calcium carbonate to react?
- 5 min
- 15 min
- 17.5 min.
- 22.5 min
Solution:
(A) 5 min
Explanation:
Since the total volume of carbon dioxide gas collected when all the calcium carbonate is completely reacted with is \(80 cm^3\), then half of the calcium carbonate (limiting reactant) used will produce 40 cm3 of carbon dioxide gas. From the graph, the time taken for 40 cm3 of carbon dioxide gas to be produced is 5 min.
Conclusion
In the article, we learned about the two different methods to investigate the speed of a reaction. We also learned how to interpret graphs and the gradients to determine the speed of reaction. The article is useful for students studying the O Level Chemistry syllabus.
Keep Learning! Keep Improving!
| Continue Learning | |
|---|---|
| Metals | Introduction to Organic Chemistry |
| Alcohols | Speed of Reaction |
| Electrolysis | Energy Changes |
| Ammonia | Alkanes |
| Alkenes | Carboxylic Acids |