Functions & Linear Graphs 1
In this chapter, we will be discussing the below-mentioned topics in detail:
- Cartesian coordinates in two dimensions
- Linear functions
- Graph of a set of ordered pairs as a representation of a relationship between two variables
- Graphs of linear functions
Cartesian Plane
A Cartesian plane consists of two number lines intersecting at right angles at the point O, known as the origin.
The horizontal number line is known as the x-axis.
The vertical number line is known as the y-axis.
Cartesian Coordinates
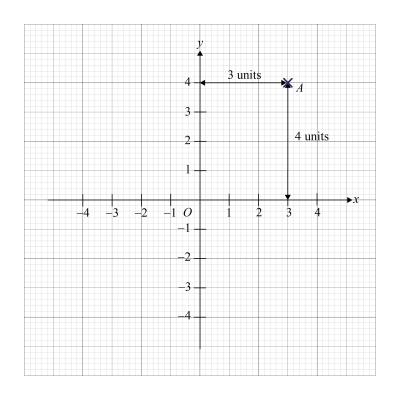
The position of any point on the plane can be determined by its distance from each of the axes.
Point A is 4 units above the x-axis and 3 units to the right of the y-axis.
Hence, A has coordinates (3, 4).
In other words, A(3, 4).
3 is the x-coordinate of A.
4 is the y-coordinate of A.
Functions

A function is a relationship between two variables, \(\displaystyle{x}\) and \(y\), such that every input \(x\) gives exactly one output \(y\).
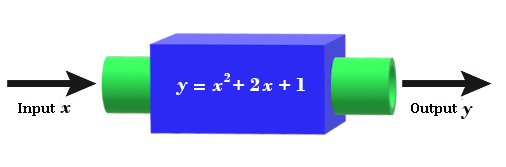
| \(\displaystyle{y = x+2}\) | \(\begin{align*} y=x^2+2x+1 \end{align*}\) | \(\begin{align*} y=x^3+x^2+x+1 \end{align*}\) |
|---|---|---|
| Equation of a Linear Function. | Equation of a Quadratic Function. | Equation of a Cubic Function. |
Let's understand with the help of an example:
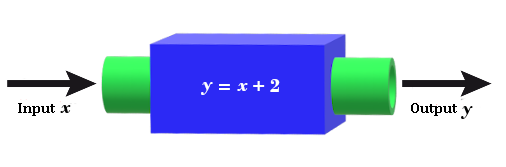
If we input a value of \(x\) into the function 'machine', each value of \(x\) will be added by 2.
Hence, from the other side of the machine, we would get the output “\(y\)”.
So let's put some values in the above table.
| \(x\) | \(0\) | \(1\) | \(2\) | \(3\) |
|---|---|---|---|---|
| \(y\) | \(\text{When } x= 0\\ \begin{align} \\ y &=0+2\\ y &=2 \end{align}\) | \(\text{When } x= 1\\ \begin{align} \\ y &=1+2\\ y &=3 \end{align}\) | \(\text{When } x= 2\\ \begin{align} \\ y &=2+2\\ y &=4 \end{align}\) | \(\text{When } x= 3\\ \begin{align} \\ y &=3+2\\ y &=5 \end{align}\) |
| \(x\) | \(0\) | \(1\) | \(2\) | \(3\) |
|---|---|---|---|---|
| \(y\) | \(\begin{align} &\text{When}\; x=0 \\ \\ &y=(0)^2+(0)+1\\ &y=1 \end{align} \) | \(\begin{align*} &\text{When} \; x =1,\\\\ &y =(1)^2+(1)+1\\ &y =3 \end{align*}\) | \(\begin{align*} &\text{When} \; x =2,\\\\ &y =(2)^2+(2)+1\\ &y=7\end{align*}\) | \(\begin{align*} &\text{When} \; x =3,\\\\ &y =(3)^2+(3)+1\\ &y =13 \end{align*}\) |
Question 1:
The equation of a function is \(y=3x+2\). Find
- The value of \(y\) when \(x=1.5\),
- The value of \(x\) when \(y=-1\).
Solution:
- Substituting the value of \(x=1.5\)
\(\begin{align*} y&=3x+2\\ &=3(1.5)+2\\y&=6.5 \end{align*}\)
- Substituting the value of \(y=-1\)
\(\begin{align*} y&=3x+2\\ -1&=3x+2\\-1-2&=3x\\-3&=3x\\x&=-1 \end{align*}\)
Graphs of Linear Functions
Question 2:
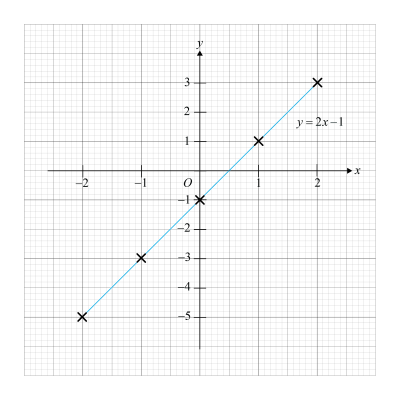
- Draw the graph of a linear function \(y=2x-1\), for values of \(x\) from −2 to 2 inclusive.
Use a scale of 2 cm to represent 1 unit on the x-axis and 1 cm to represent 1 unit on the y-axis. - Using your graph, find
- the value of \(x\) when \(y=2\)
- the value of \(y\) when \(x=0.5\)
Solution:
Step 1:
Draw the table of values for \(x\) and \(y\). These ordered pairs of values for \(x\) and \(y\) (also known as coordinates) satisfy the equation of the function \(y=2x-1\).
| \(x\) | \(-2\) | \(-1\) | \(0\) | \(1\) |
| \(y\) | \(-5\) | \(-3\) | \(-1\) | \(1\) |
Step 2:
Draw and label the x-axis (horizontal) and y-axis (vertical) using the given scales.
The scale on the graph paper is such that 1 small box is 1 cm.
Step 3:
Plot each pair of coordinates from the table of values as points on the Cartesian plane.
Step 4:
Draw and label the line of best fit.
- (i)
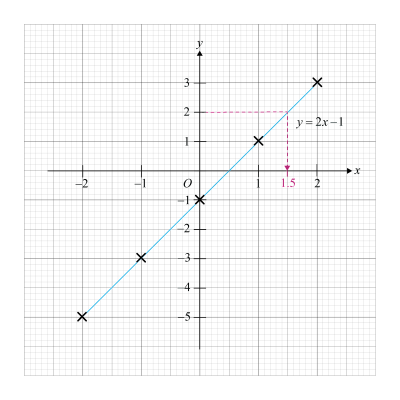
Using the graph, when \(y = 2\), \(x = 1.5\).
(ii).
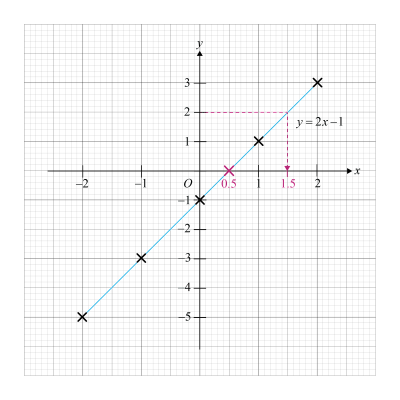
Using the graph, when \(x = 0.5\), \(y = 0\).
| Continue Learning | |
|---|---|
| Basic Geometry | Linear Equations |
| Number Patterns | Percentage |
| Prime Numbers | Ratio, Rate And Speed |
| Functions & Linear Graphs 1 | Integers, Rational Numbers And Real Numbers |
| Basic Algebra And Algebraic Manipulation 1 | Approximation And Estimation |