Fundamentals Of Pie Chart
Definition - A Pie Chart is a type of chart that represents data in a circular graph. It is divided into slices that represent the relative size of the data. In a pie chart, the area is proportional to the quantity it represents.
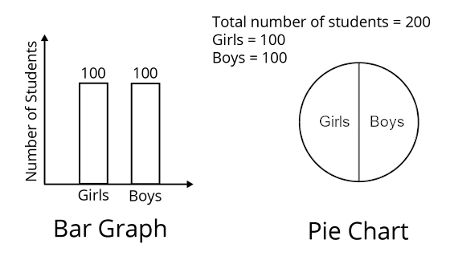
Consider that there are 200 students in a Maths class. Out of 200 students, 100 are boys and 100 are girls. We can represent this information in the form of different charts like bar graphs, pie charts etc. Let us see how it works.
To understand pie charts, we need to know fractions, percentages, and ratio well. In this article, we will study pie charts through fractions, ratios, and percentages.
Pie Chart Diagram And Fractions
A pie chart diagram represents data visually, dividing a circle into sectors proportional to the quantity each represents. Each sector's size shows its fraction of the whole, making it a useful tool for displaying proportions. It's directly related to fractions, as each sector's size can be expressed as a fraction or percentage of the total, aiding in understanding parts-to-whole relationships in data sets.
Example:
What fraction of the diagram below is shaded?

Conversion Of Decimals, Fractions and Percentages
Conversion between decimals, fractions, and percentages is essential in mathematics and everyday life. Here's a brief overview:
-
Decimal to Fraction: To convert a decimal to a fraction, place the decimal value over the appropriate power of \(10\) and simplify. For example, \(0.25\) is \(\displaystyle\frac{25}{100}\), which simplifies to \(\displaystyle\frac{1}{4}\).
-
Fraction to Percentage: Convert the fraction to a decimal first, then multiply by \(100\) and add a percentage sign. For example, \(\displaystyle\frac{1}{5}\) becomes \(0.20\), which is \(20\%\).
These conversions are fundamental in various mathematical operations, such as solving equations, interpreting data, and understanding proportions.
Conversion of decimals, fractions, and percentages is crucial for creating and interpreting pie charts.
Let’s understand through the below table.
| Decimal | Fraction | Percentage |
|---|---|---|
| \(\small{\displaystyle{0.28}}\) | \(\small{\displaystyle{\frac{28}{100} = \frac{7}{25}}}\) | \(\small{\displaystyle{28\%}}\) |
| \(\small{\displaystyle{0.24}}\) | \(\small{\displaystyle{\frac{24}{100} = \frac{6}{25}}}\) | \(\small{\displaystyle{24\%}}\) |
| \(\small{\displaystyle{0.25}}\) | \(\small{\displaystyle{\frac{1}{4} = \frac{25}{100}}}\) | \(\small{\displaystyle{25\%}}\) |
Pie Chart Diagram Examples Involving Fractions, Percentages & Ratios
Pie Chart Diagram Examples Involving Fractions, Percentages & Ratios:
- Fractions: A pie chart diagram showing \(\displaystyle{\frac{1}{2}}\) of the circle shaded represents \(50\%\) of the total.
- Percentages: A pie chart diagram with a sector representing \(75\%\) of the whole circle visually demonstrates \(\displaystyle{\frac{3}{4}}\) the proportion.
- Ratios: A pie chart illustrating a \(2:3\) ratio would have sectors sized accordingly, reflecting the relationship between the parts.
Lets Solve few example questions
Question 1:
Express the following parts of diagram as a percentage and as a fraction.

| Fraction | Percentage | |
|---|---|---|
| \(\text{(a)}\) | \(\small{\displaystyle{\frac {1}{2}}}\) | \(\small{\displaystyle{50\%}}\) |
| \(\text{(b)}\) | \(\small{\displaystyle{\frac {32}{100} = \frac {8}{25}}}\) | \(\small{\displaystyle{100\% - 50\% - 18\% = 32\%}}\) |
Question 2:
Express the following parts of diagram as a percentage and as a fraction:

| Part | Fraction | Percentage |
|---|---|---|
| \(\text{(a)}\) | \(\small{\displaystyle{\frac {7}{20}}}\) | \(\small{\displaystyle{50\% - 15\% = 35\%}}\) ( Due to the property of vertically opposite angles, (a) is the same proportion as (c) ) |
| \(\text{(b)}\) | \(\small{\displaystyle{\frac {15}{100} = \frac {3}{20}}}\) | \(\small{\displaystyle{15\%}}\) ( Due to the property of vertically opposite angles, (a) is the same proportion as \(\small{\displaystyle{15\%}}\) ) |
| \(\text{(c)}\) | \(\small{\displaystyle{\frac {35}{100} = \frac {7}{20}}}\) | \(\small{\displaystyle{50\% - 15\% = 35\%}}\) |
Question 3:
The pie chart diagram below shows the places of interest visited by \(1836\) pupils this year. Half of the total number of pupils visited Chinatown and the rest of the pupils visited Sentosa, Night Safari and Bird Park. Given that the same number of pupils visited Sentosa, Night Safari and Bird Park, find the number of pupils who visited Sentosa this year.

Solution:
Fraction of pupils who visited Chinatown
\(\small{\displaystyle{= \frac{1}{2}}}\)
Number of pupils who visited Chinatown
\(\displaystyle\small{\displaystyle{= 1836 \div 2}}\\[2ex] \small{\displaystyle{= 918}}\)
( Total number of pupils who visited \(\displaystyle\small{= 918}\)
Sentosa, Night Safari and Bird Park )
Number of pupils who visited Sentosa
\(=\) Number of pupils who visited Night Safari
\(=\) Number of pupils who visited Bird Park
Number of pupils who visited Bird Park
\(\displaystyle\small{= 918 \div 3}\\[2ex] \displaystyle\small{= 306}\)
Answer:
\(\small{\displaystyle{306}}\) pupils
Question 4:
The pie chart diagram shows the savings of five children in a month. Ken’s savings were \(\small\displaystyle\frac{2}{5}\) of Ann’s savings. How much more money did Ann save than Ken?

Solution:
Percentage representing Ian’s savings
\(\small{\displaystyle{=\frac {1}{4} \times 100\%}}\\[2ex] \small{\displaystyle{= 25\%}}\)
Percentage representing Bob’s savings
\(\small{\displaystyle{=\frac {1}{5} \times 100\%}}\\[2ex] \small{\displaystyle{=20\%}}\)
\(\small{\displaystyle{25\%}}\) of the total savings of the \(\small{\displaystyle{5}}\) children \(\small{\displaystyle{= $75}}\)
\(\small{1\%}\) of the total\(\small{\begin{align}&= $75 \div 25\\[2ex]&= $3 \end{align}}\)
Percentage representing the total of Ken’s savings and Ann’s savings
\(\small{\displaystyle{= 100\% - 13\% - 10\% - 25\%}}\\[2ex] \small{\displaystyle{= 42\%}}\)
Total of Ken’s savings and Ann’s savings
\(\small{\displaystyle{= 42\%}}\) of the total
\(\small{\displaystyle{= 42 \times $3}}\\[2ex] \small{\displaystyle{= $126}}\)
Since Ken’s savings were \(\small{\displaystyle{\frac {2}{5}}}\) of Ann’s savings, let Ken’s savings be represented by \(\small{\displaystyle{2}}\) units and let Ann’s savings be represented by \(\small{\displaystyle{5}}\) units.
Total number of units of Ken’s savings and Ann’s savings
\(=\small{\displaystyle{2 \text{ units} + 5 \text{ units}}}\\[2ex] =\small{\displaystyle{7 \text{ units}}}\)
Now,
\(\small{ \begin{align} 7 \text{ units} &= $126 \\[2ex] 1 \text{ unit} &= $126 \div 7 \\[2ex] &= $18 \end{align}}\)
Difference between Ken’s savings and Ann’s savings
\(=\small{\displaystyle{5 \text{ units} - 2 \text{ units}}}\\[2ex] =\small{\displaystyle{3 \text{ units}}}\)
Extra money saved by Ann than Ken
\(=\small{\displaystyle{3 \times $18}}\\[2ex] =\small{\displaystyle{$54}}\)
Answer:
\(\small{\displaystyle{$54}}\)
Question 5:
The pie chart diagram below shows the types of fruits at a stall. Given that there are \(\small{84}\) oranges and twice as many pears as kiwis, what percentage of the fruits is pears?

Solution:
\(\small{\begin{align} \frac{1}{4} \text{ of the total fruits} &= 84 \\[2ex] \frac{4}{4} \text{ of the total fruits} &= 4 \times 84 \\[2ex] &= 336 \end{align}}\)
Since there are twice as many pears as kiwis, let the number of kiwis be represented by 1 unit and the number of pears be represented by 2 units.
\(\small{\begin{align} 3 \text{ units} &= 84 \\[2ex] 1 \text{ unit} &= 84 \div 3 \\[2ex] &= 28 \end{align}}\)
\(\small{\begin{align} \text{Number of pears} &= 2 \text{ unit}\\[2ex] &= 2 × 28 \\[2ex] &= 56 \end{align}}\)
\(\small{\begin{align} \text{Percentage of pears} &= \frac{56}{336} \times 100\%\\[2ex] &= 16\frac{2}{3}\% \end{align}}\)
Answer:
\(\small{\displaystyle{16\frac{2}{3}\%}}\)
Practice Questions
Question 1:
The pie chart diagram below shows the expenditure of Mrs Wong’s monthly salary. If she spent \(\displaystyle{\frac{1}{3}}\) of her monthly salary on groceries, how much was her monthly salary?

Solution:
Fraction representing the amount of money on car loan, education and savings
\(\displaystyle\small{=1 - \frac{1}{3}\\[2ex] = \frac{2}{3}}\)
\(\small\displaystyle\frac {2}{3}\) of Mrs Wong’s monthly salary
\(=\small{ $250 + $960 + $680}\\[2ex] = \small{$1890}\)
\(\displaystyle\small\frac{1}{3}\) of Mrs Wong’s monthly salary
\(= \small{$1890 \div 2}\\[2ex] = \small{$945}\)
\(\displaystyle\small\frac{1}{3}\) of Mrs Wong’s monthly salary
\(= \small{3 \times $945}\\[2ex] = \small{$2835}\)
Answer:
\(\small{$2835}\)
Question 2:
The pie chart diagram shows the amount of money that Tommy spent in a month. Find the amount of money Tommy spent on food.

Solution:
Fraction of money Tommy spent on car loan
\(\displaystyle\small{= \frac {1} {4}}\)
Fraction of money Tommy spent on food
\(\displaystyle\small{= 1 - \frac {1}{3} - \frac {1}{12} - \frac{1}{4} \\[2ex] = \frac{1}{3}}\)
\(\displaystyle\small{\frac{1}{4}}\) of the amount of money Tommy spent in a month
\(\displaystyle\small{= $780}\)
\(\displaystyle\small{\frac{4}{4}}\) of the amount of money Tommy spent in a month
\(\displaystyle\small{= 4 \times $780\\[2ex] = $3120}\)
Amount of money Tommy spent on food
\(\displaystyle\small{= \frac{1}{3}}\) of the amount of money Tommy spent in a month
\(\displaystyle\small{\,\\= \frac{1}{3} \times $3120 \\[3ex] = $1040}\)
Answer:
\(\small{$1040}\)
Question 3:
The pie chart diagram below shows the favourite subjects of the pupils in a class. How many pupils chose Mathematics as their favourite subject?

Solution:
\(\small{\begin{align} \frac{1}{4} \text{ of the pupils} &= 13\\[2ex]\frac{1}{4} \text{ of the pupils} &= 4 \times 13\\ &= 52\\\\ \end{align}}\)
Number of pupils who chose Mathematics as their favourite subject
\(=\small{52 - 13 - 13 - 7}\\[2ex] = \small{19}\)
Answer:
\(\small{19}\) pupils
Question 4:
The pie chart diagram shows the favourite television channel of the students in a class. What percentage of the students chose sports?

Solution:
Percentage of students who chose Disney
\(\displaystyle\small{= \frac {1}{8} \times 100\%\\[3ex] = 12.5\%}\)
Percentage of students who chose Cartoon Network
\(\small{\displaystyle{ = \frac{1}{5} \times 100\%\\[3ex] = 20\%}}\)
Percentage of students who chose Sports
\(\displaystyle\small{= 100\% – 12.5\% – 20\% – 65\%\\[3ex] = 2.5\%}\)
Answer:
\(\small{2.5\%}\)
Question 5:
The pie chart diagram below shows the different kinds of fruits sold by Uncle Lim. He sold \(\small{425}\) mangoes. How many durians did he sell?

Solution:
Percentage of fruits sold that are mangoes \(\small{= 25\%}\)
\(\small{25\%}\) of the fruits sold \(\small{= 425}\)
\(\small{1\%}\) of the fruits sold \(\small{= 425 \div 25 \\[2ex] = 17}\)
Percentage of durians sold
\(\small{= 100\% – 25\% – 12\% – 15\% \\[3ex] = 48\%}\)
Number of durians sold
\(\small{= 48\% \text{ of the fruits} \\[3ex] = 48 \times 17 \\[3ex] = 816}\)
Answer:
\(\small{816}\) durians
Question 6:
The pie chart diagram below shows how Tommy spent his money. What percentage of money did he spend on food?

Solution:
Percentage of money spent on transport and savings
\(= \displaystyle{\small{\bigg( \frac{1}{4} + \frac{1}{4} \bigg) × 100\%}}\\[3ex] = \displaystyle{\small{\frac{1}{4} × 100\%}}\\[3ex] = \displaystyle{\small{50\%}}\)
Percentage of money spent on food and books
\(= \small{\displaystyle{100\% - 50\%}}\\[3ex] = \small{\displaystyle{50\%}}\)
Total amount of money Tommy spent on transport and savings
\(= \small{\displaystyle{200\% + 200\%}}\\[3ex] = \small{\displaystyle{$400}}\)
\(\small{50\%}\) of Tommy’s money\(\small{= $400}\)
Total amount of money Tommy spent on food and books
\(\small{= $400}\)
Amount of money Tommy spent on food
\(\small{= $400 – $180 \\[3ex] = $220}\)
Total amount of money Tommy has
\(\small{= 2 \times $400 \\[2ex] = $800}\)
Percentage of Tommy’s money spent on food
\(\displaystyle\small{= \frac{220}{800} \times 100\% \\[3ex] = 27.5\%}\)
Answer:
\(\small{27.5\%}\)
Conclusion
In this article, we looked at pie charts in fractions, percentages and decimals. We also revised the conversions between fractions, percentages, and decimals.
The key to becoming better is practice, practice and more practice. Hope this article helped you to understand pie charts better.
| Continue Learning | |
| Algebra | Distance, Speed and Time |
| Volume of Cubes and Cuboid | Fundamentals Of Pie Chart |
| Finding Unknown Angles | Number Patterns: Grouping & Common Difference |
| Fractions Of Remainder | Fractions - Division |
| Ratio | Repeated Identity: Ratio Strategies |