Picture Graphs 1
In this article, we will learn about Picture Graphs:
- Reading picture graphs
Topic Recap:
Look at the picture below.

We can arrange the fruits above and put them into a picture graph as shown below. The picture graph allows us to count and compare the fruits in a more systematic way.

Example:
- How many apples are there?
Answer:
\(5\) apples
- The number of __________ is the least.
Solution:
There are \(5\) apples, \(6\) oranges, and \(3\) watermelons.
The number of watermelons is the least.
Answer:
Watermelons
- How many fruits are there altogether?
Solution:
\(5 + 6 + 3 = 14 \)
Answer:
\(14\) fruits
1. Reading Picture Graphs
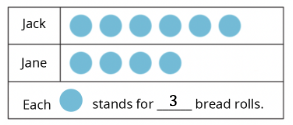
The picture below shows the number of bread rolls Jane and Jack have.

After counting, we know that:
Jane has \(12\) bread rolls.
Jack has \(18\) bread rolls.
We can make a picture graph to represent the number of bread rolls Jack and Jane have individually. Instead of drawing each bread roll repeatedly, we have a simpler way to represent the given data.
Since every plate has \(3\) bread rolls, we can represent every \(3\) bread rolls using a symbol. It saves us the trouble of drawing so many bread rolls! Therefore, the picture graph representing the given information is as below:
While using a picture graph, we need to find out how many items each symbol represents. Picture graphs are useful especially when we have large numbers of items that we want to compare.
Example:
The picture graph below shows the number of slices of pizza ‘The Pizza Stall’ sold last week. Fill in the blanks based on the picture graph below:
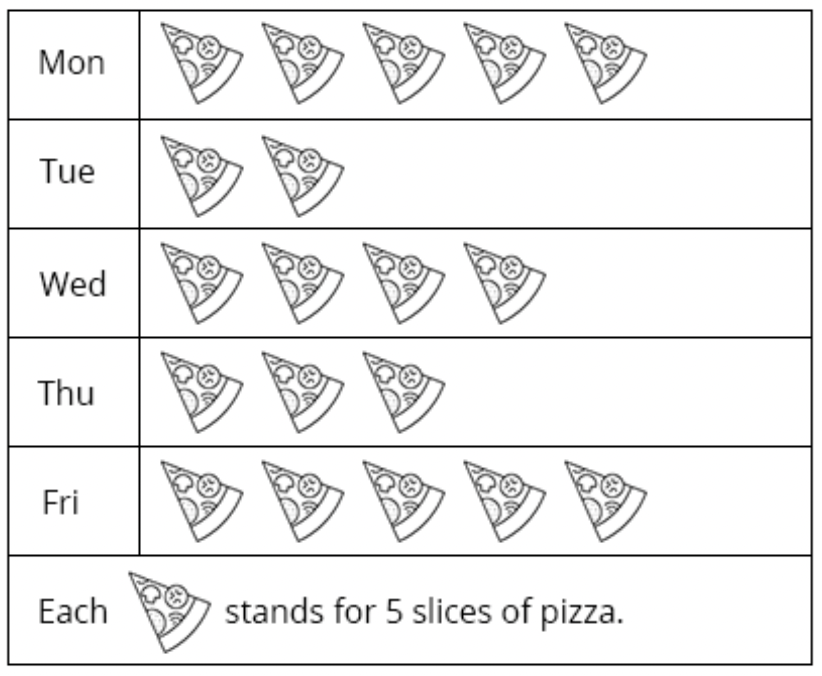
- The Pizza Stall sold the least number of slices of pizza on __________.
- The Pizza Stall sold the same number of slices of pizza on __________ and __________.
- The Pizza Stall sold __________ slices of pizza altogether.
Solution:
Number of slices of pizza sold on Monday
\(\begin{align} &= 5 \times 5 \\[2ex] &= 25 \end{align}\)
Number of slices of pizza sold on Tuesday
\(\begin{align} &= 2 \times 5 \\[2ex] &= 10 \end{align}\)
Number of slices of pizza sold on Wednesday
\(\begin{align} &= 4 \times 5 \\[2ex] &= 20 \end{align}\)
Number of slices of pizza sold on Thursday
\(\begin{align} &= 3 \times 5 \\[2ex] &= 15 \end{align}\)
Number of slices of pizza sold on Friday
\(\begin{align} &= 5 \times 5 \\[2ex] &= 25 \end{align}\)
- The least number of slices of pizzas sold was \(10\).
So, the Pizza Stall sold the least number of slices of pizza on Tuesday.
Answer:
Tuesday
- The Pizza Stall sold \(25\) slices of pizza on Monday and \(25\) slices of pizza on Friday.
So, the Pizza Stall sold the same number of slices of pizza on Monday and Friday.
Answer:
Monday and Friday
- Total number of slices of pizza sold
\(\begin{align} &= 25 + 10 + 20 + 15 + 25 \\[2ex] &= 95 \end{align}\)
Answer:
\(95\) slices
Question 1:
The picture graph below shows the number of burritos \(3\) boys sold during a food fair.

- Who sold the most number of burritos?
- Mark
- Jason
- Samuel
Answer:
(3) Samuel
- How many burritos did Mark sell?
- \(5\)
- \(7\)
- \(10\)
- \(12\)
Solution:
Number of burritos Mark sold
\(\begin{align} &= 5 \times 2 \\[2ex] &= 10 \end{align} \)
Answer:
(3) 10
- How many burritos did the boys sell altogether?
- \(17\)
- \(24\)
- \(32\)
- \(34\)
Solution:
Number of burritos Mark sold \(= 10 \)
Number of burritos Jason sold
\(\begin{align} &= 4 \times 2 \\[2ex] &= 8 \end{align}\)
Number of burritos Samuel sold
\(\begin{align} &= 8 \times 2 \\[2ex] &= 16 \end{align}\)
Total number of burritos sold
\(\begin{align} &= 10 + 8 + 16 \\[2ex] &= 34 \end{align}\)
Answer:
(4) \(34\)
Question 2:
The picture graph shows the number of stamps collected by 4 students.
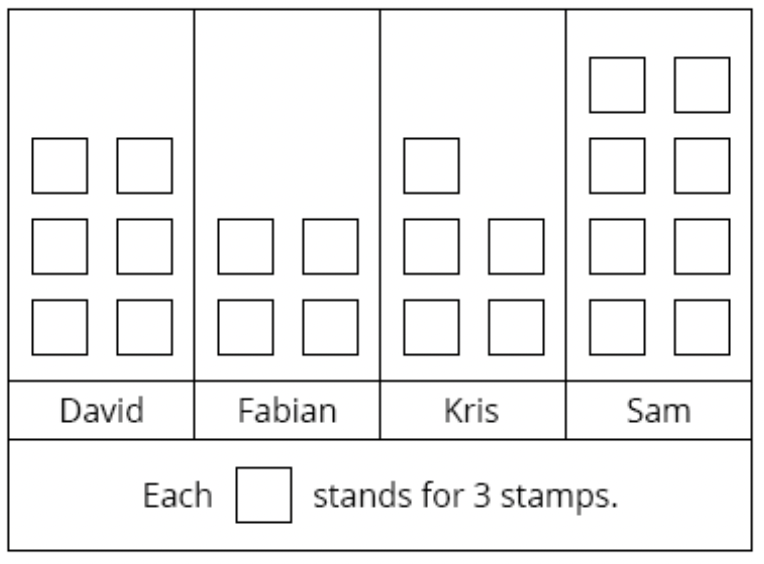
- How many stamps did Sam collect?
- \(8\)
- \(11\)
- \(16\)
- \(24\)
Solution:
Number of stamps Sam collected
\(\begin{align} &= 8 × 3 \\[2ex] &= 24 \end{align}\)
Answer:
(4) \(24\)
- How many stamps did Fabian and Kris collect?
- \(9 \)
- \(18\)
- \(27\)
- \(46\)
Solution:
Number of stamps Fabian sold
\(\begin{align} &= 4 \times 3 \\[2ex] &=12 \end{align}\)
Number of stamps Kris sold
\(\begin{align} &= 5 \times 3 \\[2ex] &= 15 \end{align}\)
The total number of stamps collected by Fabian and Kris
\(\begin{align} &= 12 + 15 \\[2ex] &= 27 \end{align}\)
Answer:
(3) \(27\)
Question 3:
The picture below shows the number of pet dogs in \(5\) housing estates.

- Which \(2\) estates have the same number of pet dogs?
- Cherry Town and Peach Villa
- Peach Villa and Apricot Ville
- Cherry Town and Berry Town
Answer:
(2) Peach Villa and Apricot Ville
- How many pet dogs are there in Kiwi Bay?
- \(6\)
- \(2\)
- \(8\)
- \(4\)
Solution:
Number of dogs in Kiwi Bay
\(\begin{align} &= 2 \times 4 \\[2ex] &= 8 \end{align}\)
Answer:
(3) \(8\)
- How many pet dogs are there in the five estates altogether?
- \(17\)
- \(34\)
- \(68\)
- \(70\)
Solution:
Number of pet dogs in Cherry Town
\(\begin{align} &= 4 × 4\\[2ex] &= 16 \end{align}\)
Number of pet dogs in Peach Ville
\(\begin{align} &= 3 \times 4\\[2ex] &= 12 \end{align}\)
Number of pet dogs in Apricot Ville
\(\begin{align} &= 3 \times 4\\[2ex] &= 12 \end{align}\)
Number of pet dogs in Berry Town
\(\begin{align} &= 5 \times 4 \\[2ex] &= 20 \end{align}\)
Number of pet dogs in Kiwi Bay
\(\begin{align} &= 2 \times 4 \\[2ex] &= 8 \end{align}\)
Total number of pet dogs
\(\begin{align} &= 16 + 12 + 12 + 20 + 8\\[2ex] &= 68 \end{align}\)
Answer:
(3) \(68\)
Question 4:
The picture graph shows the number of marbles collected by \(4\) children.
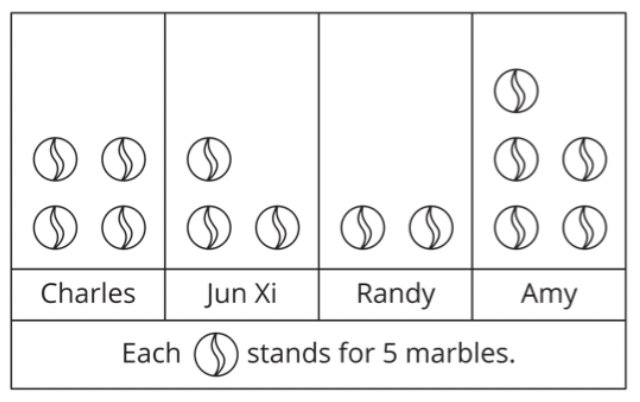
- How many more marbles did Amy collect than Randy?
- \(10\)
- \(15\)
- \(20\)
- \(25\)
Solution:
Number of marbles collected by Amy
\(\begin{align} &= 5 \times 5 \\[2ex] &= 25 \end{align}\)
Number of marbles collected by Randy
\(\begin{align} &= 2 \times 5 \\[2ex] &= 10 \end{align}\)
Difference in marbles between Amy and Randy
\(\begin{align} &= 25 - 10 \\[2ex] &= 15 \end{align}\)
Answer:
(2) \(15\)
- Who collected twice as many marbles as Randy?
- Charles
- Jun Xi
- Amy
Solution:
Number of marbles Randy collected \(= 10 \)
Number of marbles that is twice of \(10\)
\(\begin{align} &= 2 \times 10 \\[2ex] &= 20 \end{align}\)
Number of marbles collected by Amy \(= 25\)
Number of marbles collected by Jun Xi
\(\begin{align} &= 3 \times 5 \\[2ex] &= 15 \end{align}\)
Number of marbles collected by Charles
\(\begin{align} &= 4 \times 5 \\[2ex] &= 20 \end{align}\)
So, Charles collected twice as many marbles as Randy.
Answer:
(1) Charles
Question 5:
The picture graph represents the number of hotdogs sold by \(3\) children.
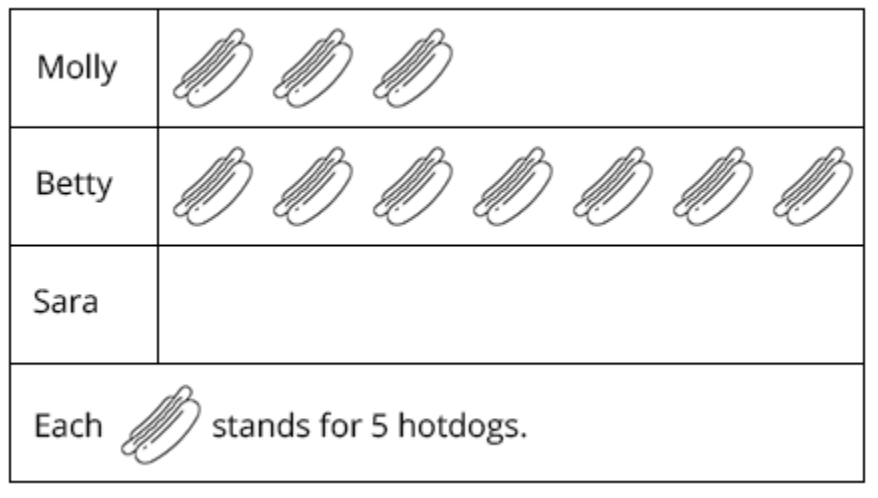
- Given that the 3 children sold 80 hotdogs in all, how many hotdogs did Sara sell?
- \(20\)
- \(30\)
- \(35\)
- \(40\)
Solution:
Number of hotdogs sold by Molly
\(\begin{align} &= 3 \times 5 \\[2ex] &= 15 \end{align}\)
Number of hotdogs sold by Betty
\(\begin{align} &= 7 \times 5 \\[2ex] &= 35 \end{align}\)
Number of hotdogs sold by Molly and Betty
\(\begin{align} &= 15 + 35 \\[2ex] &= 50 \end{align}\)
Total hotdogs sold \(= 80\)
Number of hotdogs sold by Sara
\(\begin{align} &= 80 - 50 \\[2ex] &= 30 \end{align}\)
Answer:
(2) \(30\)
In this article, we have learned about Picture Graphs:
- Reading picture graphs