Bar Graphs
Bar graphs are visual representations of data in the form of either vertical or horizontal bars, where the length of the bars is proportional to the data or the value. They are also known as Bar charts.
The table shows the number of students who voted for their favourite colour.
| Colour | Pink | Blue | Green | Yellow | Red |
|---|---|---|---|---|---|
| Number of students | \(6\) | \(10\) | \(2\) | \(3\) | \(8\) |
The bar graph of the data shown above is as shown below.

In this article, the learning objectives are:
- Interpret values and change in bar graphs
1. Interpret values and change in bar graphs
To interpret values on a bar graph, we will need to determine the value of each interval first, and then identify the value of each subject.
Question 1:
The bar graph shows the number of cookies sold by four boys.

- What is the value of each interval?
Solution:
Number of cookies represented by 2 intervals \(= 10\)
Number of cookies represented by 1 interval \(= 10 \div 2\)
\(= 5\)
Answer:
5 cookies
- How many cookies did the boys sell altogether?
Solution:
Number of cookies Adam sold \(= 20\)
Number of cookies Ben sold\(\begin{align}\\[2ex] &= 30 + 5\\[2ex] &= 35 \end{align}\)
Number of cookies Chris sold\(\begin{align}\\[2ex] &= 20 + 5\\[2ex] &= 25 \end{align}\)
Number of cookies Dan sold \(\,= 40\)
Total number of cookies\(\begin{align}\\[2ex] &= 20 + 35 + 25 + 40\\[2ex] &= 120 \end{align} \)
Answer:
120
Question 2:
The graph below shows the number of people who visited a museum over four days.

How many people visited the museum on Tuesday?
- 43
- 50
- 55
- 58
Solution:
Number of people represented by 4 intervals \(= 20\)
Number of people represented by 1 interval \(= 20 \div 4 \)
\(= 5\)
Number of people represented by 3 intervals \(= 3 \times 5\)
\(= 15\)
Number of people who visited the museum on Tuesday\(\begin{align}\\[2ex] &= 40 + 15\\[2ex] &= 55 \end{align}\)
Answer:
(3) 55
Question 3:
The bar graph below shows the number of visitors to the Butterfly Park from August to December.
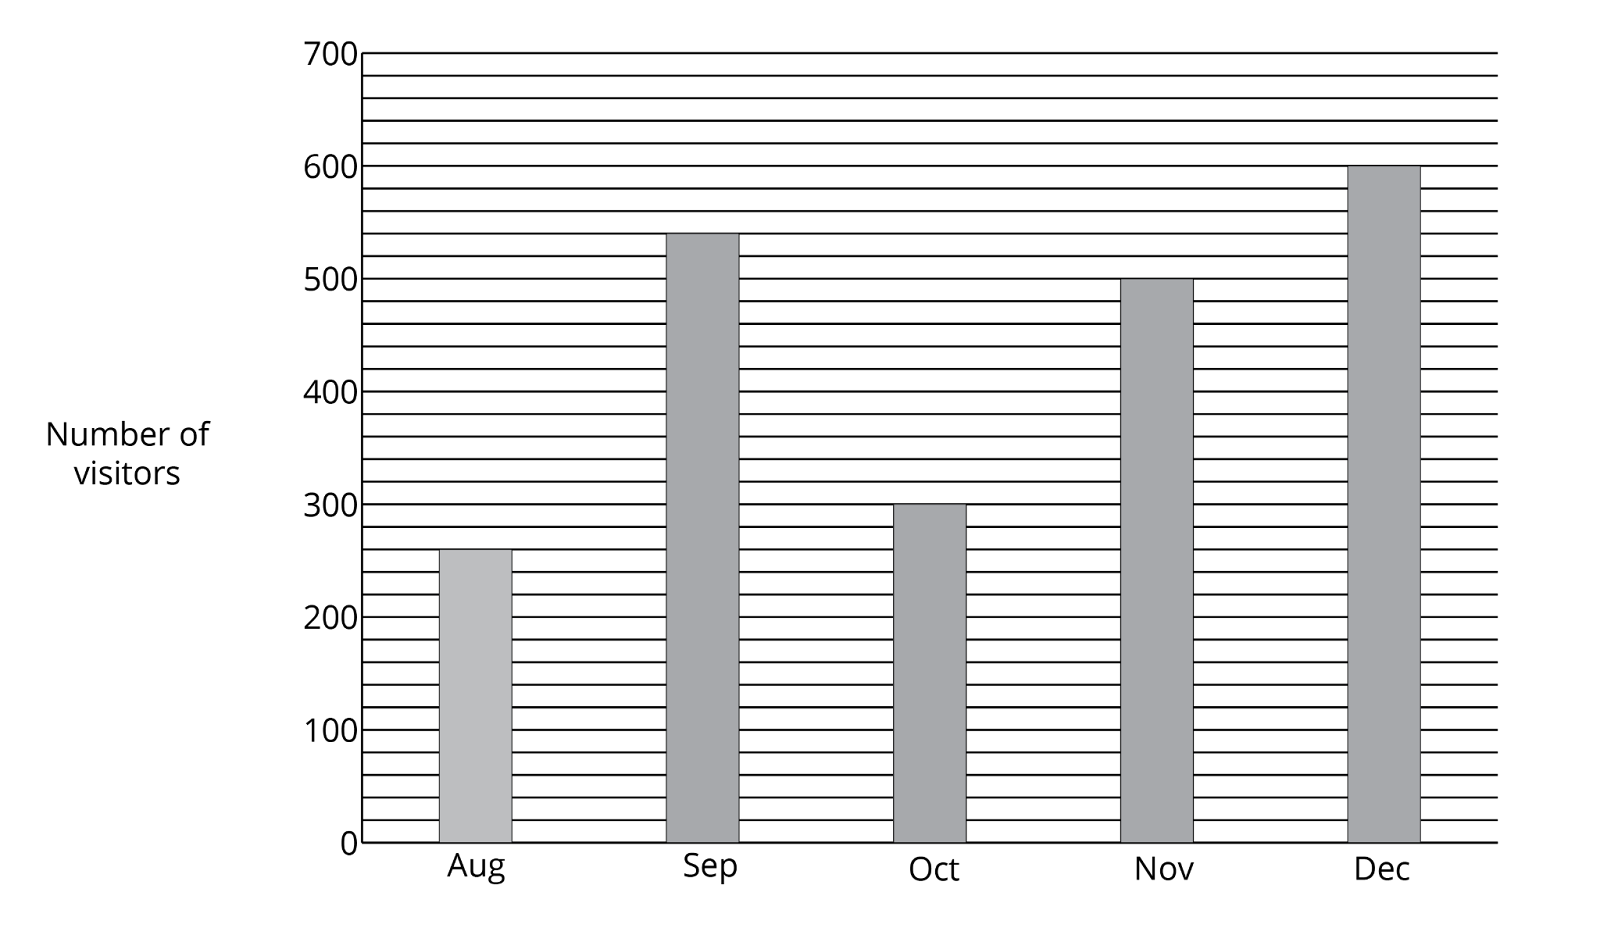
In a particular month, there were 540 visitors to the Butterfly Park. Which month was it?
Solution:
Number of visitors represented by 5 intervals \(= 100\)
Number of visitors represented by 1 interval \(= 100 \div 5 \)
\(= 20\)
Number of visitors represented by 3 intervals \(= 3 \times 20\)
\(= 60\)
Number of people who visited the Butterfly Park in August\(\begin{align}\\[2ex] &= 200 + 60\\[2ex] &= 260 \end{align}\)
Number of visitors represented by 2 intervals \(= 2 \times 20\)
\(= 40\)
Number of people who visited the Butterfly Park in September\(\begin{align}\\[2ex] &= 500 + 40\\[2ex] &= 540 \end{align}\)
Number of people who visited the Butterfly Park in October \(= 300\)
Number of people who visited the Butterfly Park in November \(= 500\)
Number of people who visited the Butterfly Park in December \(= 600\)
540 people visited the Butterfly Park in September.
Answer:
September
Question 4:
The bar graph shows the number of animals sold in a pet shop.

How many more dogs than cats were sold?
Solution:
Number of dogs \(= 20\)
Number of cats \(= 12\)
Difference between the number of dogs and the number of cats\(\begin{align}\\[2ex] &= 20 - 12\\[2ex] &= 8 \end{align}\)
Answer:
8
Question 5:
The bar graph shows the amount of water in 3 containers.
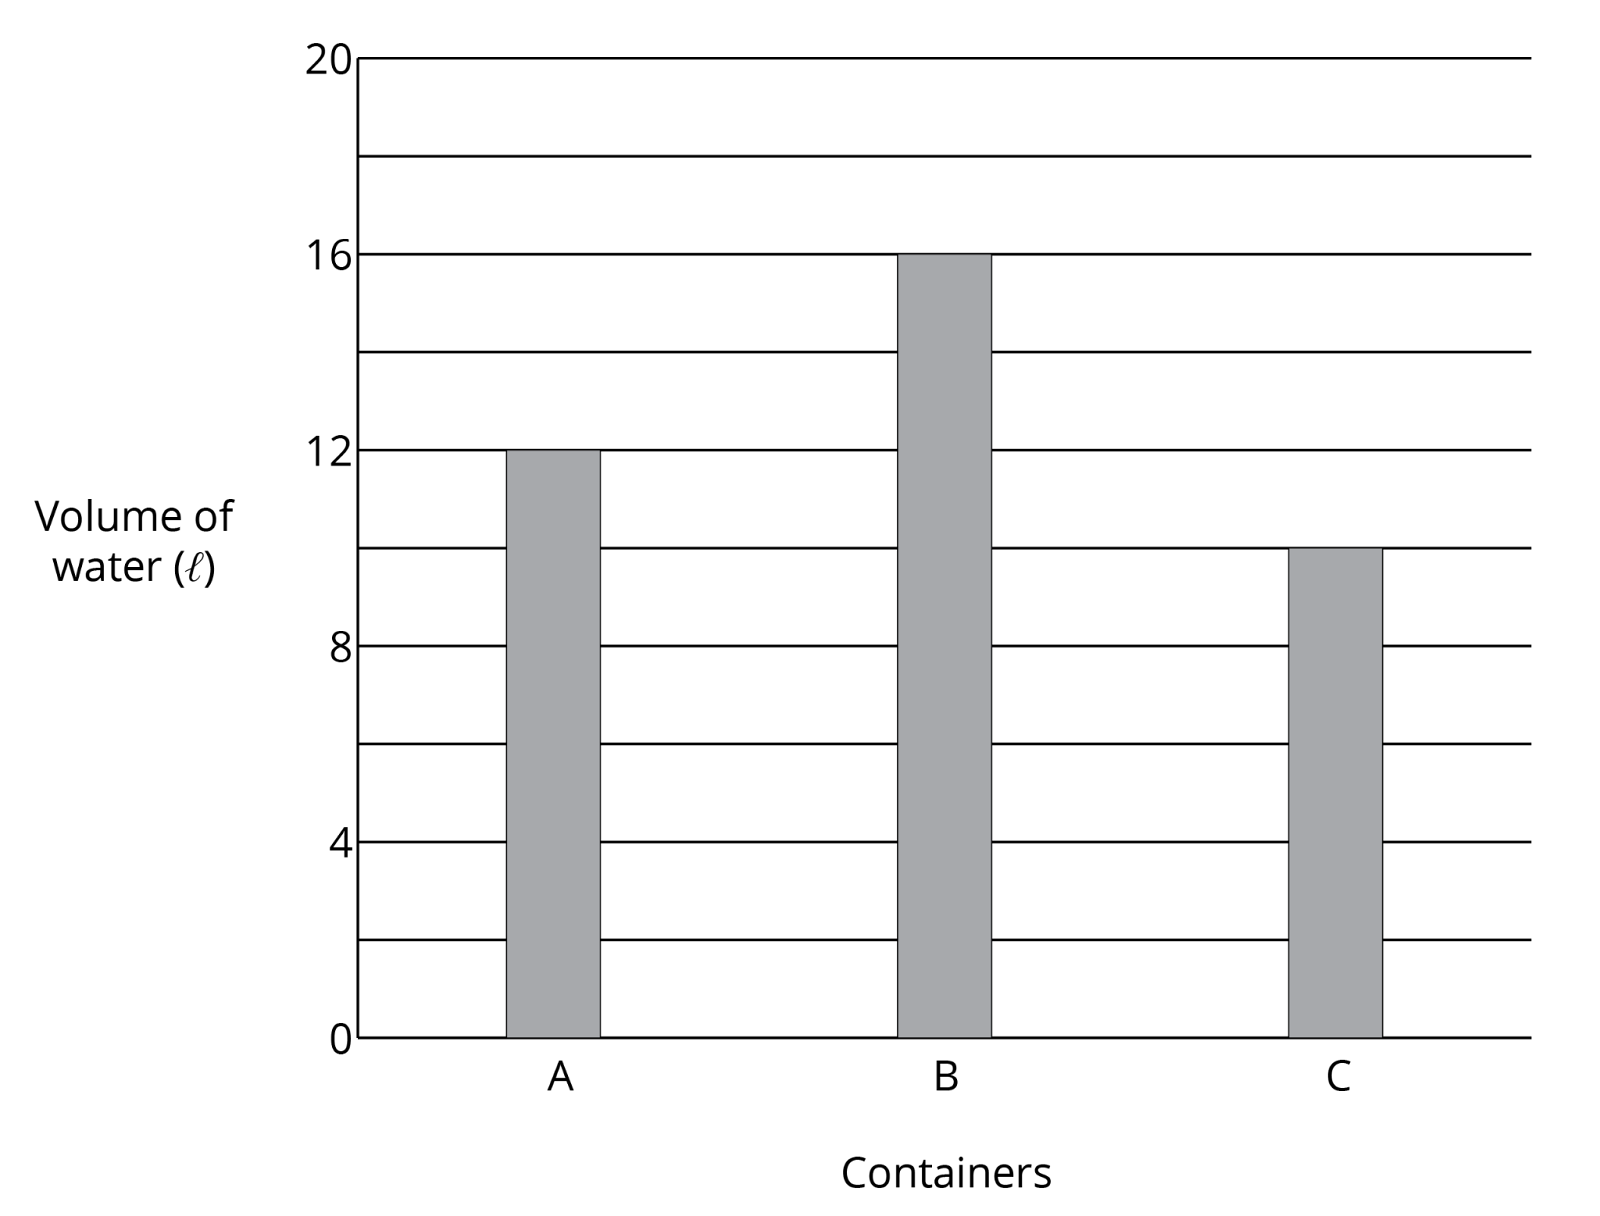
What is the total amount of water in containers A, B and C?
- 22 ℓ
- 26 ℓ
- 28 ℓ
- 38 ℓ
Solution:
Volume of water represented by 2 intervals \(= 4 \;ℓ\)
Volume of water represented by 1 interval \(= 4\; ℓ \div 2 \)
\(= 2 \;ℓ\)
Volume of water in Container A \(= 12 \;ℓ\)
Volume of water in Container B \(= 16 \;ℓ\)
Volume of water in Container C\(\begin{align}\\[2ex] &= 8\; ℓ + 2\; ℓ\\[2ex] &= 10\; ℓ \end{align}\)
Total volume of water in Containers A, B and C\(\begin{align}\\[2ex] &= 12\; ℓ + 16\; ℓ + 10\; ℓ\\[2ex] &= 38\; ℓ \end{align}\)
Answer:
(4) 38 ℓ
Question 6:
The bar graph shows the Science test marks of 7 children. The passing mark for the test is 45.
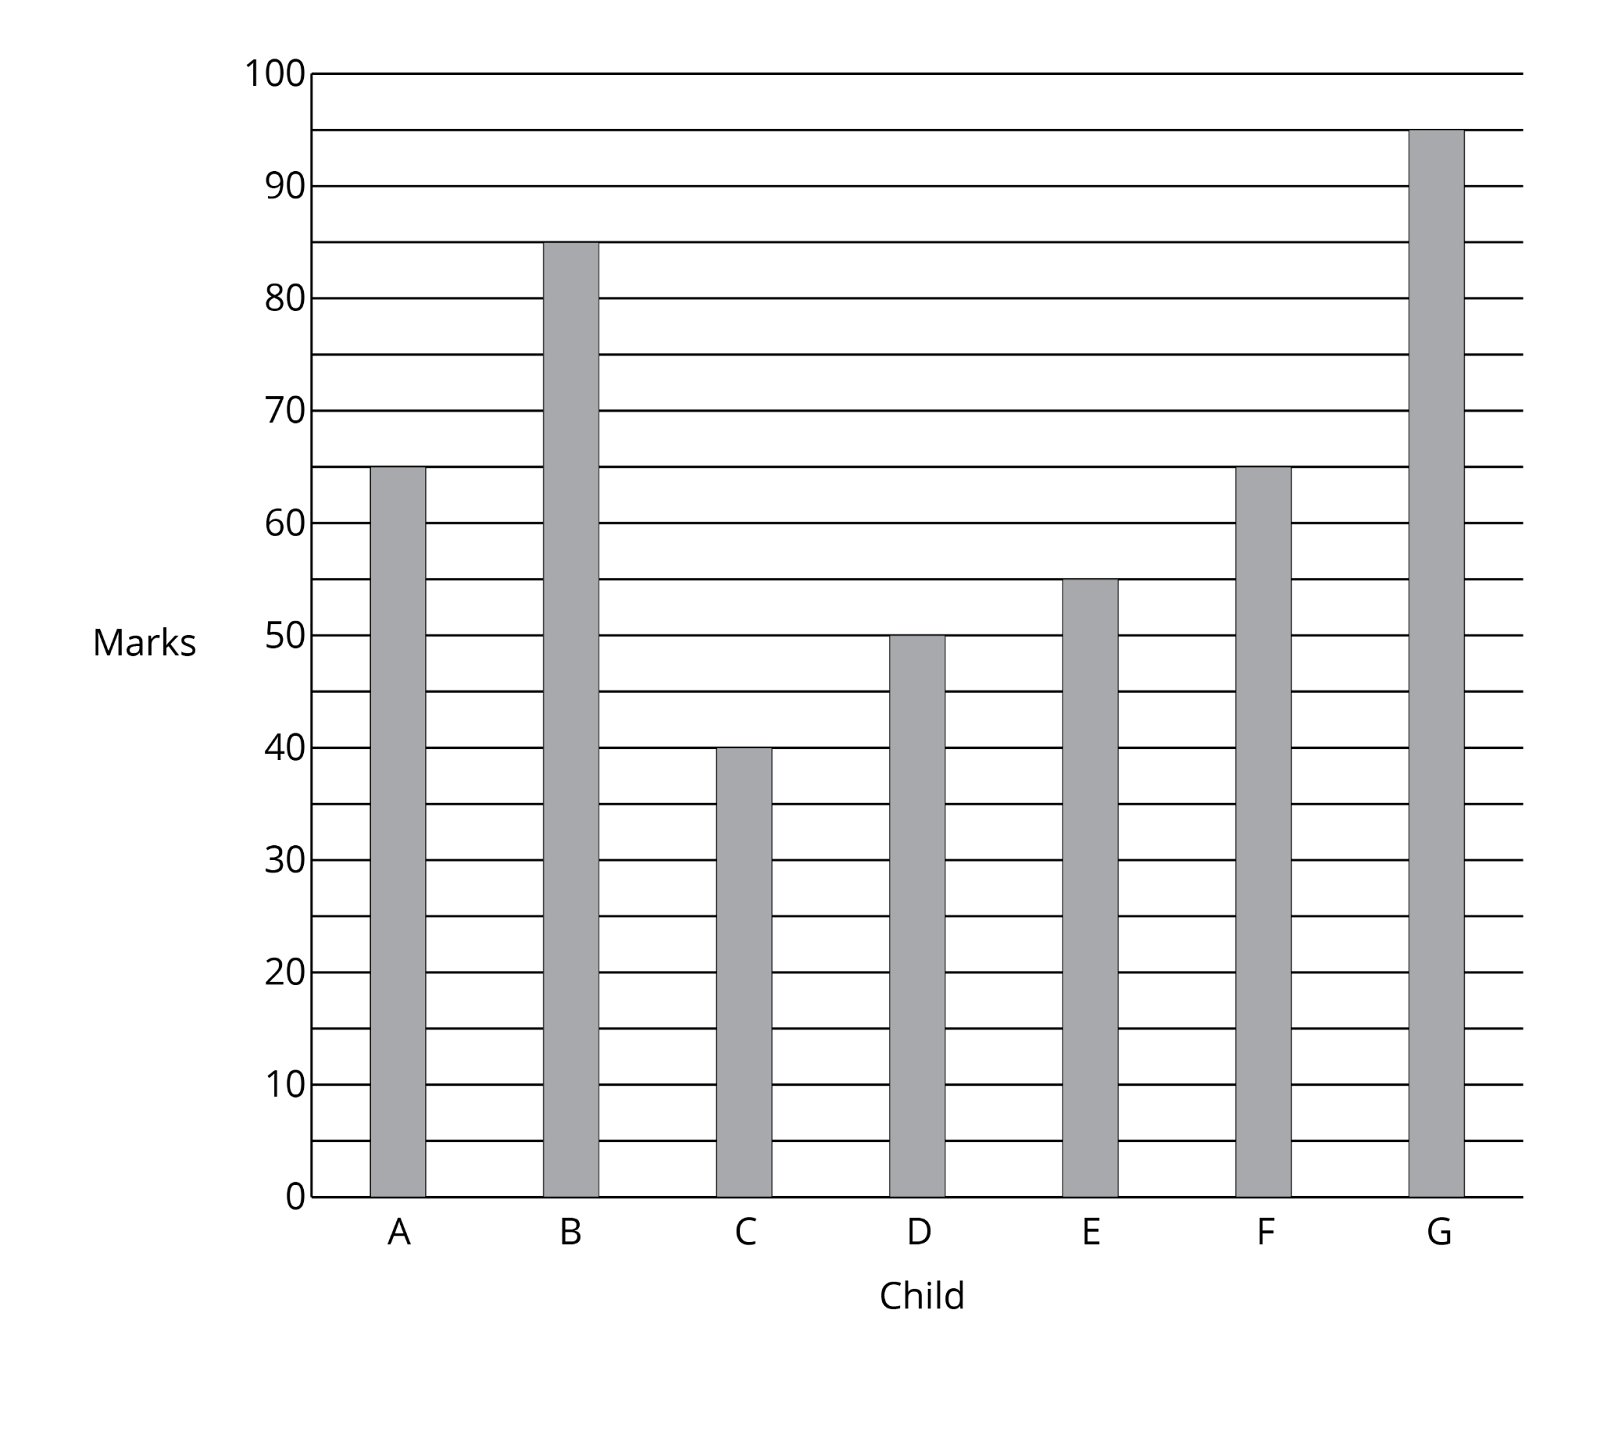
How many children passed the test?
- 6
- 5
- 3
- 4
Solution:
Marks represented by 2 intervals \(= 10\)
Marks represented by 1 interval \(= 10 \div 2\)
\(= 5\)
Any student having a score of 45 marks or above passes the test. The 6 students as highlighted below are the students who score 45 or more marks.
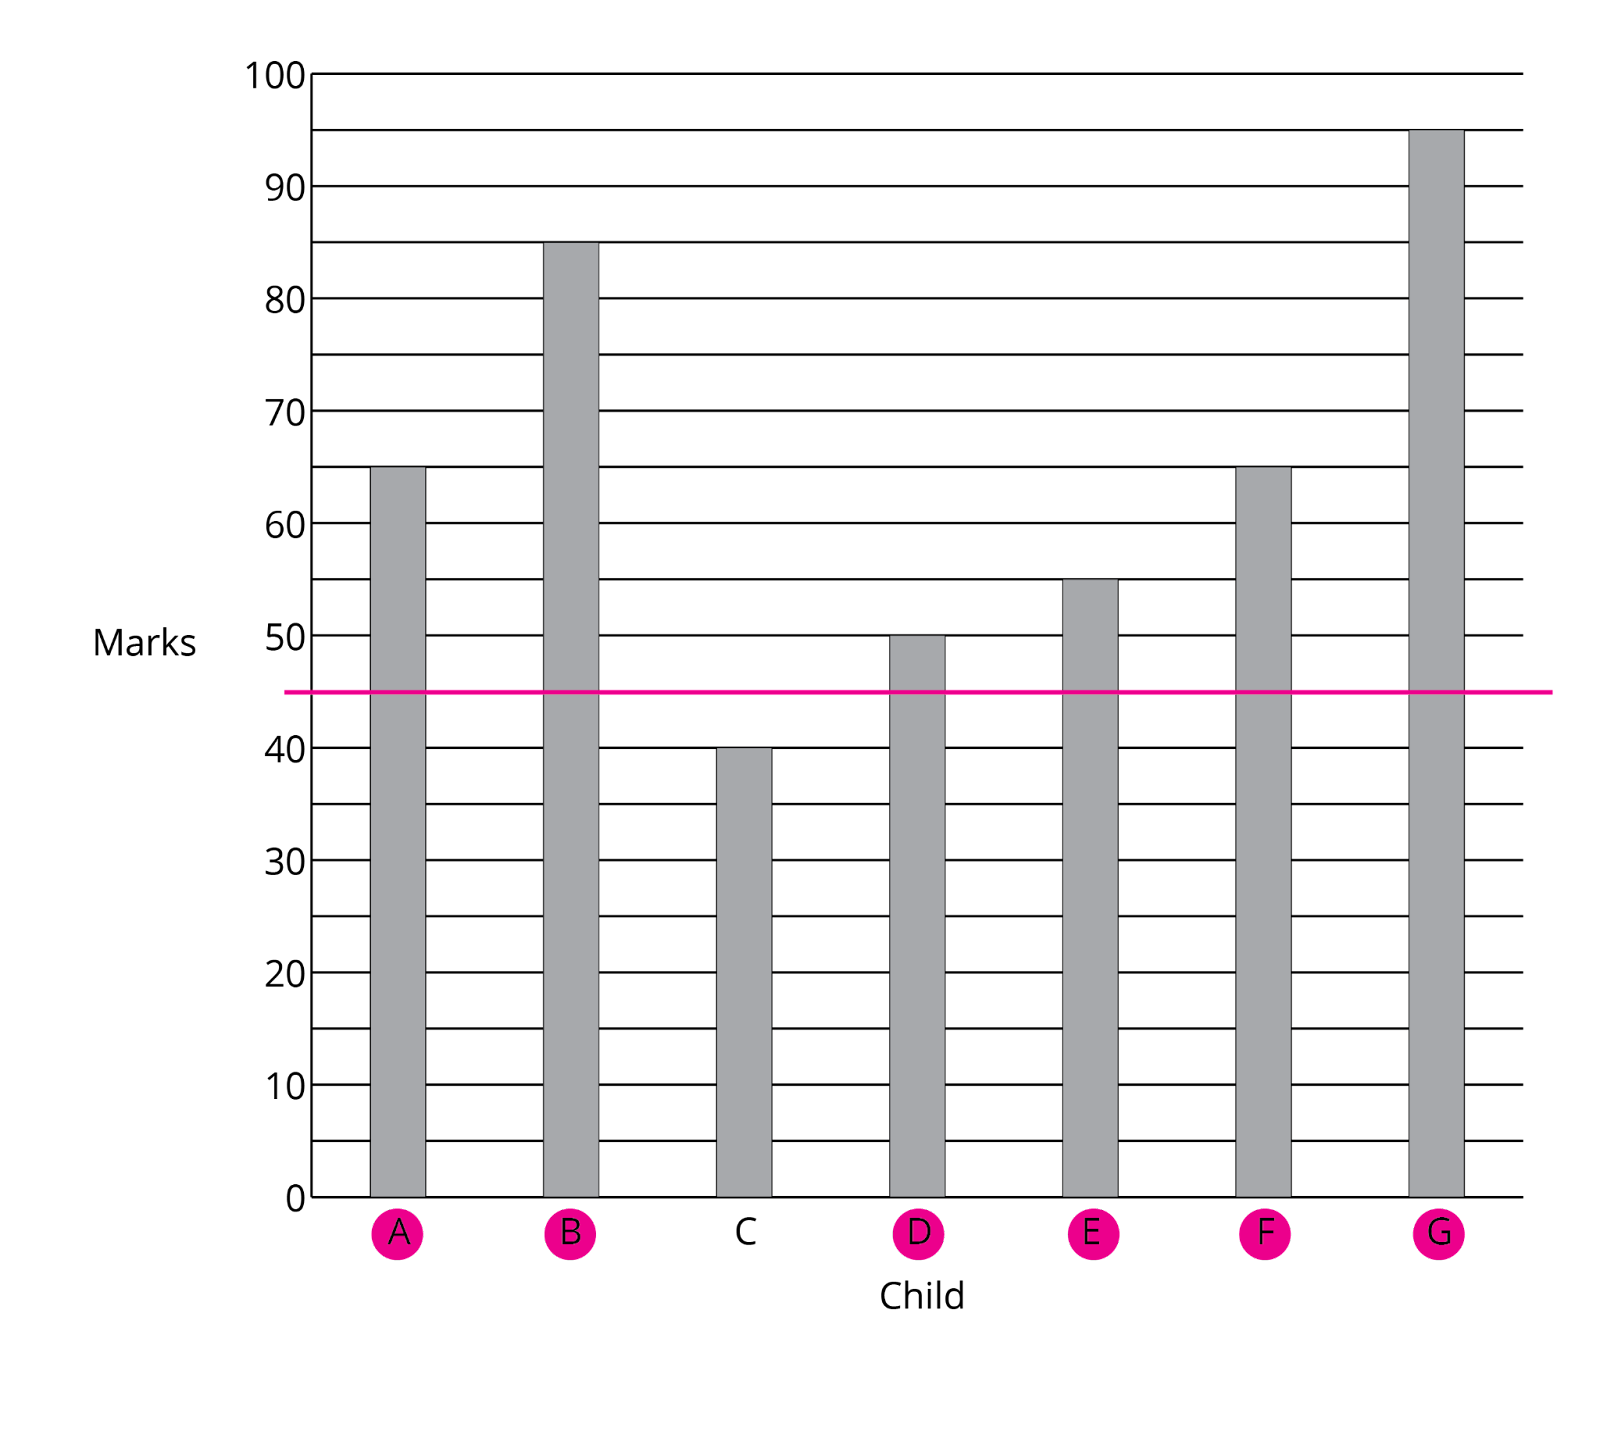
Answer:
(1) 6
Question 7:
The bar graph shows the number of storybooks read by the pupils in a class.

What was the total number of storybooks read by the pupils in the class?
Solution:
| Number Of Storybooks Read | Number Of Pupils | Total Number Of Storybooks Read |
| \(1\) | \(6\) | \(6\times 1 = 6\) |
| \(2\) | \(7\) | \(7 \times 2=14\) |
| \(3\) | \(9\) | \(9 \times 3 = 27\) |
| \(4\) | \(10\) | \(10 \times 4 = 40\) |
| \(5\) | \(8\) | \(8 \times 5 = 40\) |
Total number of storybooks read by the pupils in the class\(\begin{align}\\[2ex] &= 6 + 14 + 27 + 40 + 40\\[2ex] &= 127 \end{align}\)
Answer:
127 storybooks
Question 8:
The bar graph shows the number of cakes 5 shops sold.

Which two shops sold a total of 160 cakes?
- Shop D and Shop E
- Shop A and Shop B
- Shop A and Shop C
- Shop B and Shop E
Solution:
Number of cakes represented by 2 intervals \(= 20\)
Number of cakes represented by 1 interval \(= 20 \div 2\)
\(= 10\)
| Shops Name | Cakes Sold | Remaining Cakes Out Of 160 |
|---|---|---|
| \(A\) | \(30\) | \(160 - 30 = 130\) |
| \(B\) | \(120\) | \(160 - 120 = 40\) |
| \(C\) | \(160\) | \(160 - 160 = 0\) |
| \(D\) | \(80\) | \(160 - 80 = 80\) |
| \(E\) | \(40\) | \(160 - 40 = 120\) |
Since \(120 + 40 = 160\), Shop B and Shop E sold a total of 160 cakes.
Answer:
(4) Shop B and Shop E
Question 9:
The bar graph shows the number of Primary 3 students who keep pets.
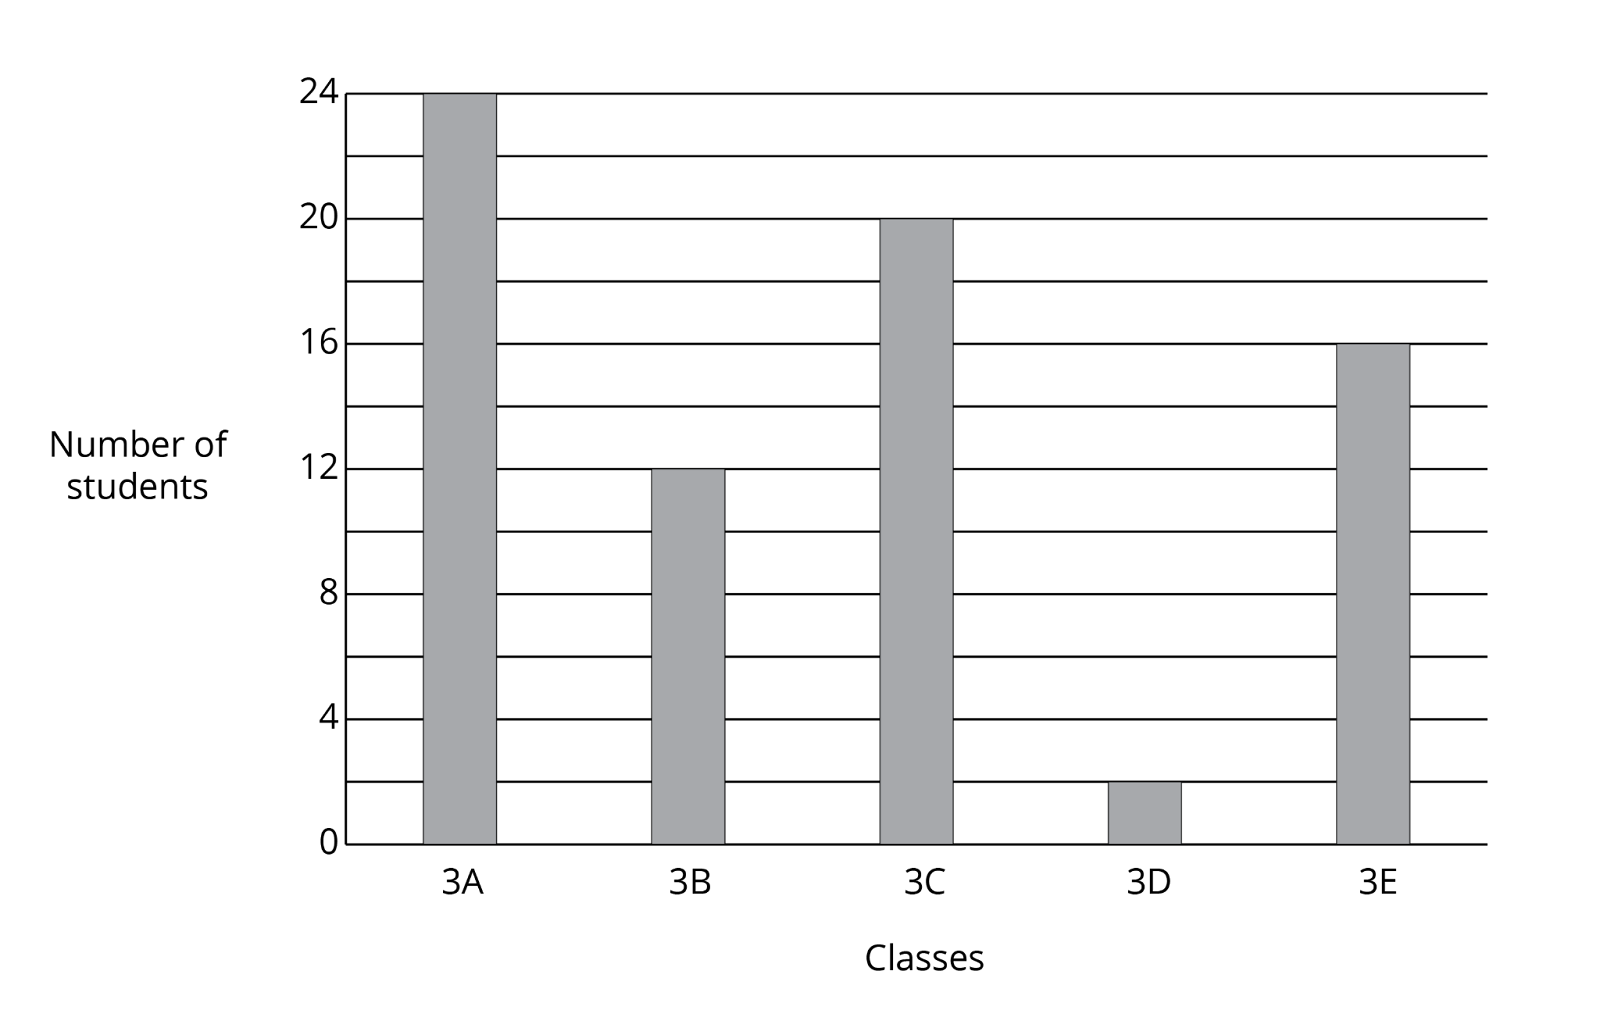
If there were 37 students in Class 3E, how many students did not keep pets?
Solution:
Number of students who keep pets in Class 3E \(= 16\)
Number of students who did not keep pets in Class 3E\(\begin{align}\\[2ex] &= 37-16\\[2ex] &= 21 \end{align}\)
21 students did not keep pets in Class 3E.
Answer:
21 students
Question 10:
The bar graph shows the number of goldfish sold by Raju in 5 months.

- In which month did Raju sell the least number of goldfish?
Solution:
Raju sold the least number of goldfish in April since the bar representing the number of goldfish sold in April is the shortest.
Answer:
April
- The total number of goldfish Raju sold in March and May is __________ more than the number of goldfish sold in July.
Solution:
Total number of goldfish sold in March and May\(\begin{align}\\[2ex] &= 30+25\\[2ex] &= 55 \end{align}\)
Difference between the total number of goldfish sold in March and May and the number of goldfish sold in July\(\begin{align}\\[2ex] &= 55-40\\[2ex] &= 15 \end{align}\)
Answer:
15 goldfish
Question 11:
The graph shows the total number of books sold in the first 6 days of its launch.

On which day was the number of books sold the greatest decrease as compared to the previous day?
- 6th day
- 5th day
- 3rd day
- 4th day
Solution:
The number of books sold increased from the 1st day to the 2nd day, from the 2nd day to the 3rd day and from the 5th day to the 6th day.
The number of books sold decreased from the 3rd day to the 4th day and from the 4th day to the 5th day.
Decrease in the number of books sold from the 3rd day to the 4th day\(\begin{align}\\[2ex] &= 1400-400\\[2ex] &= 1000 \end{align} \)
Decrease in the number of books sold from the 4th day to the 5th day\(\begin{align}\\[2ex] &= 400-200\\[2ex] &= 200 \end{align} \)
Answer:
(4) 4th day